

3
Fuels and Trends
TABLe 1.1
World’s Primary Oil Demand (Million Barrels Per Day)
2006–
2030 (%)
1980
2000
2006
2010
2015
2030
p.a.
OECD
41.8
46.0
47.3
49.0
50.8
52.9
0.5%
North America
20.9
23.4
24.9
26.2
27.7
30.0
0.8%
Europe
14.7
14.2
14.3
14.5
14.7
14.7
0.1%
Pacific
6.3
8.4
8.1
8.3
8.3
8.1
0.0%
Transition economies
9.4
4.2
4.5
4.7
5.1
5.6
0.9%
Russia
—
2.6
2.6
2.8
3.0
3.3
0.9%
Developing countries
11.3
23.1
28.8
33.7
38.7
53.3
2.6%
China
1.9
4.7
7.1
9.0
11.1
16.5
3.6%
India
0.7
2.3
2.6
3.1
3.7
6.5
3.9%
Other Asia
1.8
4.5
5.5
6.2
6.9
8.9
2.0%
Middle East
2.0
4.6
6.0
7.0
7.9
9.5
1.9%
Africa
1.3
2.3
2.8
3.1
3.4
4.8
2.2%
Latin America
3.5
4.7
4.8
5.2
5.6
7.1
1.6%
Int. marine bunkers
2.2
3.6
4.1
3.7
3.9
4.5
—
and stock changes
World
64.8
77.0
84.7
91.1
98.5
116.3
1.3%
European Union
—
13.6
13.8
13.8
14.0
13.8
0.0%
Source: World Energy Outlook 2007: China and India Insights, International Energy Agency
(IEA) © OECD/IEA, 2007, Table 1.2, page 80, www.iea.org.
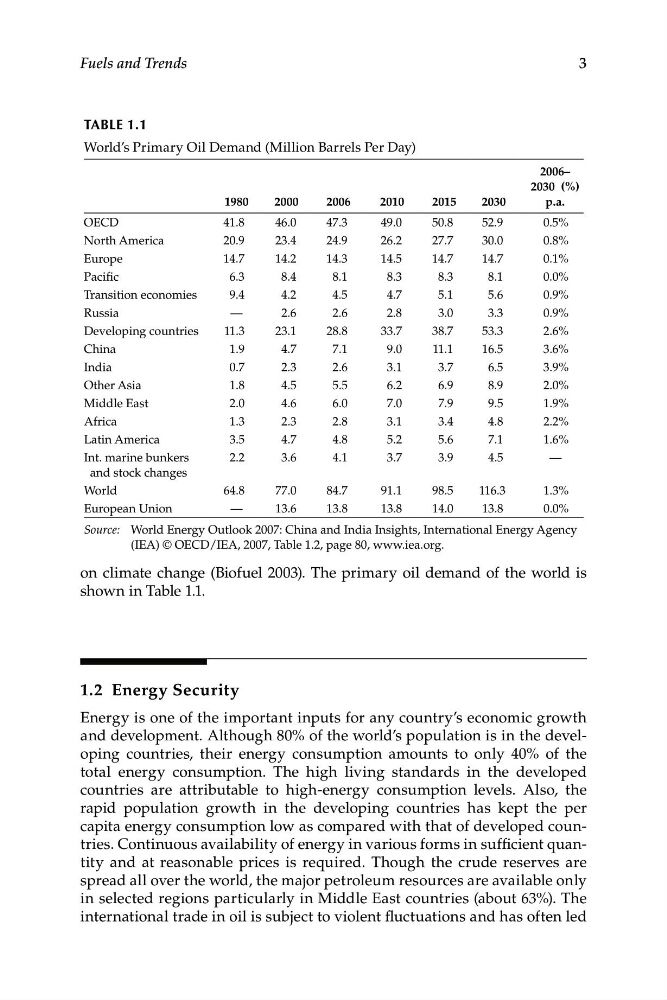
on climate change (Biofuel 2003). The primary oil demand of the world is
shown in Table 1.1.
1.2 Energy Security
Energy is one of the important inputs for any country’s economic growth
and development. Although 80% of the world’s population is in the developing countries, their energy consumption amounts to only 40% of the
total energy consumption. The high living standards in the developed
countries are attributable to high-energy consumption levels. Also, the
rapid population growth in the developing countries has kept the per
capita energy consumption low as compared with that of developed countries. Continuous availability of energy in various forms in sufficient quantity and at reasonable prices is required. Though the crude reserves are
spread all over the world, the major petroleum resources are available only
in selected regions particularly in Middle East countries (about 63%). The
international trade in oil is subject to violent fluctuations and has often led
Fuels and Trends
TABLe 1.1
World’s Primary Oil Demand (Million Barrels Per Day)
2006–
2030 (%)
1980
2000
2006
2010
2015
2030
p.a.
OECD
41.8
46.0
47.3
49.0
50.8
52.9
0.5%
North America
20.9
23.4
24.9
26.2
27.7
30.0
0.8%
Europe
14.7
14.2
14.3
14.5
14.7
14.7
0.1%
Pacific
6.3
8.4
8.1
8.3
8.3
8.1
0.0%
Transition economies
9.4
4.2
4.5
4.7
5.1
5.6
0.9%
Russia
—
2.6
2.6
2.8
3.0
3.3
0.9%
Developing countries
11.3
23.1
28.8
33.7
38.7
53.3
2.6%
China
1.9
4.7
7.1
9.0
11.1
16.5
3.6%
India
0.7
2.3
2.6
3.1
3.7
6.5
3.9%
Other Asia
1.8
4.5
5.5
6.2
6.9
8.9
2.0%
Middle East
2.0
4.6
6.0
7.0
7.9
9.5
1.9%
Africa
1.3
2.3
2.8
3.1
3.4
4.8
2.2%
Latin America
3.5
4.7
4.8
5.2
5.6
7.1
1.6%
Int. marine bunkers
2.2
3.6
4.1
3.7
3.9
4.5
—
and stock changes
World
64.8
77.0
84.7
91.1
98.5
116.3
1.3%
European Union
—
13.6
13.8
13.8
14.0
13.8
0.0%
Source: World Energy Outlook 2007: China and India Insights, International Energy Agency
(IEA) © OECD/IEA, 2007, Table 1.2, page 80, www.iea.org.
on climate change (Biofuel 2003). The primary oil demand of the world is
shown in Table 1.1.
1.2 Energy Security
Energy is one of the important inputs for any country’s economic growth
and development. Although 80% of the world’s population is in the developing countries, their energy consumption amounts to only 40% of the
total energy consumption. The high living standards in the developed
countries are attributable to high-energy consumption levels. Also, the
rapid population growth in the developing countries has kept the per
capita energy consumption low as compared with that of developed countries. Continuous availability of energy in various forms in sufficient quantity and at reasonable prices is required. Though the crude reserves are
spread all over the world, the major petroleum resources are available only
in selected regions particularly in Middle East countries (about 63%). The
international trade in oil is subject to violent fluctuations and has often led