

18
16
14
12
10
8
6
4
2
0
Billion tonnes of oil equivalent
1980
1990
2000
2010
2020
2030
Coal
Oil
Gas
Nuclear
Hydro
Biomass
Other renewables
2
Alternative Fuels for Transportation
unevenly divided across various sectors of industrialized economies, as it is
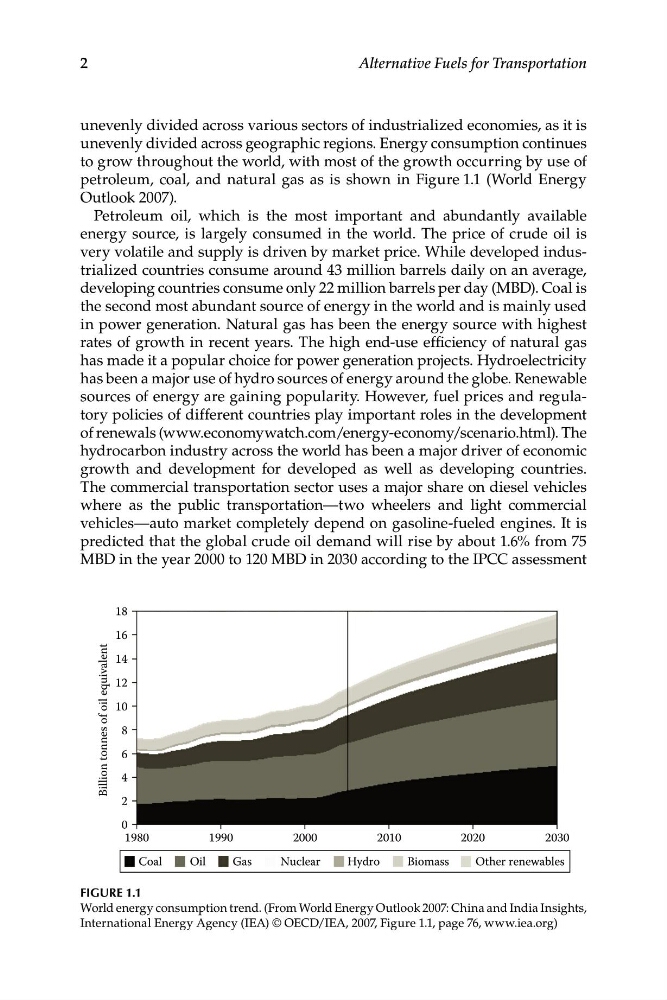
unevenly divided across geographic regions. Energy consumption continues
to grow throughout the world, with most of the growth occurring by use of
petroleum, coal, and natural gas as is shown in Figure 1 .1 (World Energy
Outlook 2007).
Petroleum oil, which is the most important and abundantly available
energy source, is largely consumed in the world. The price of crude oil is
very volatile and supply is driven by market price. While developed industrialized countries consume around 43 million barrels daily on an average,
developing countries consume only 22 million barrels per day (MBD). Coal is
the second most abundant source of energy in the world and is mainly used
in power generation. Natural gas has been the energy source with highest
rates of growth in recent years. The high end-use efficiency of natural gas
has made it a popular choice for power generation projects. Hydroelectricity
has been a major use of hydro sources of energy around the globe. Renewable
sources of energy are gaining popularity. However, fuel prices and regulatory policies of different countries play important roles in the development
of renewals (www.economywatch.com/energy-economy/scenario.html). The
hydrocarbon industry across the world has been a major driver of economic
growth and development for developed as well as developing countries.
The commercial transportation sector uses a major share on diesel vehicles
where as the public transportation—two wheelers and light commercial
vehicles—auto market completely depend on gasoline-fueled engines. It is
predicted that the global crude oil demand will rise by about 1.6% from 75
MBD in the year 2000 to 120 MBD in 2030 according to the IPCC assessment
Figure 1 .1
World energy consumption trend. (From World Energy Outlook 2007: China and India Insights,
International Energy Agency (IEA) © OECD/IEA, 2007, Figure 1 .1, page 76, www.iea.org)
16
14
12
10
8
6
4
2
0
Billion tonnes of oil equivalent
1980
1990
2000
2010
2020
2030
Coal
Oil
Gas
Nuclear
Hydro
Biomass
Other renewables
2
Alternative Fuels for Transportation
unevenly divided across various sectors of industrialized economies, as it is
unevenly divided across geographic regions. Energy consumption continues
to grow throughout the world, with most of the growth occurring by use of
petroleum, coal, and natural gas as is shown in Figure 1 .1 (World Energy
Outlook 2007).
Petroleum oil, which is the most important and abundantly available
energy source, is largely consumed in the world. The price of crude oil is
very volatile and supply is driven by market price. While developed industrialized countries consume around 43 million barrels daily on an average,
developing countries consume only 22 million barrels per day (MBD). Coal is
the second most abundant source of energy in the world and is mainly used
in power generation. Natural gas has been the energy source with highest
rates of growth in recent years. The high end-use efficiency of natural gas
has made it a popular choice for power generation projects. Hydroelectricity
has been a major use of hydro sources of energy around the globe. Renewable
sources of energy are gaining popularity. However, fuel prices and regulatory policies of different countries play important roles in the development
of renewals (www.economywatch.com/energy-economy/scenario.html). The
hydrocarbon industry across the world has been a major driver of economic
growth and development for developed as well as developing countries.
The commercial transportation sector uses a major share on diesel vehicles
where as the public transportation—two wheelers and light commercial
vehicles—auto market completely depend on gasoline-fueled engines. It is
predicted that the global crude oil demand will rise by about 1.6% from 75
MBD in the year 2000 to 120 MBD in 2030 according to the IPCC assessment
Figure 1 .1
World energy consumption trend. (From World Energy Outlook 2007: China and India Insights,
International Energy Agency (IEA) © OECD/IEA, 2007, Figure 1 .1, page 76, www.iea.org)