

Ethanol
157
Temperature, °C
60
40
20
Butanol
Ethanol
blend µ - emulsion
0
–20
–40
Gasoline
Fuel
No. 1
diesel
No. 2
diesel
?
?
?
?
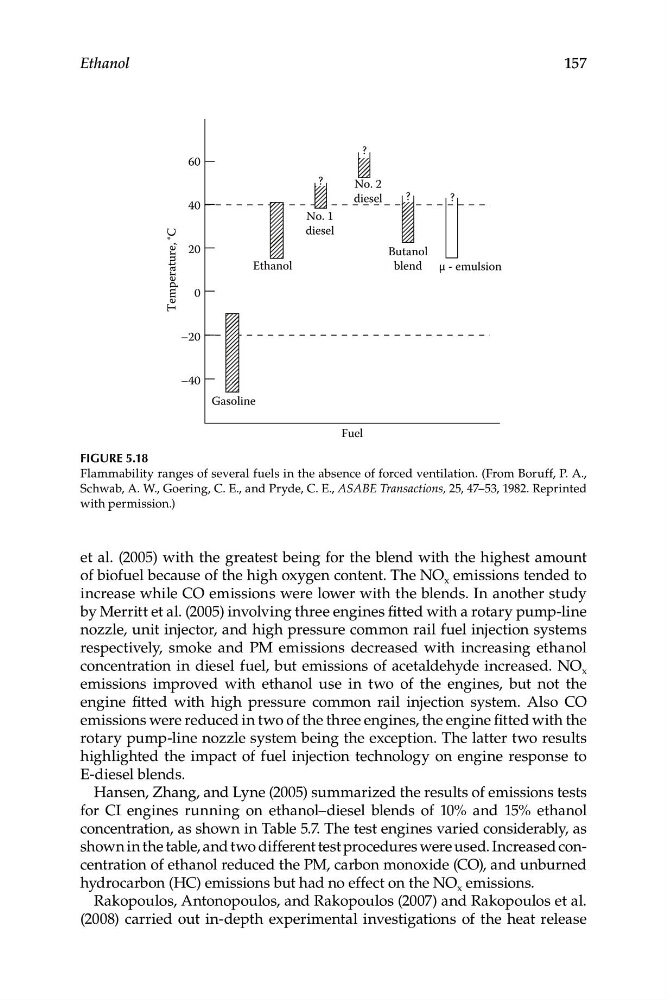
Figure 5.18
Flammability ranges of several fuels in the absence of forced ventilation. (From Boruff, P. A.,
Schwab, A. W., Goering, C. E., and Pryde, C. E., ASABE Transactions, 25, 47–53, 1982. Reprinted
with permission.)
et al. (2005) with the greatest being for the blend with the highest amount
of biofuel because of the high oxygen content. The NO x emissions tended to
increase while CO emissions were lower with the blends. In another study
by Merritt et al. (2005) involving three engines fitted with a rotary pump-line
nozzle, unit injector, and high pressure common rail fuel injection systems
respectively, smoke and PM emissions decreased with increasing ethanol
concentration in diesel fuel, but emissions of acetaldehyde increased. NO x
emissions improved with ethanol use in two of the engines, but not the
engine fitted with high pressure common rail injection system. Also CO
emissions were reduced in two of the three engines, the engine fitted with the
rotary pump-line nozzle system being the exception. The latter two results
highlighted the impact of fuel injection technology on engine response to
E-diesel blends.
Hansen, Zhang, and Lyne (2005) summarized the results of emissions tests
for CI engines running on ethanol–diesel blends of 10% and 15% ethanol
concentration, as shown in Table 5.7. The test engines varied considerably, as
shown in the table, and two different test procedures were used. Increased concentration of ethanol reduced the PM, carbon monoxide (CO), and unburned
hydrocarbon (HC) emissions but had no effect on the NO x emissions.
Rakopoulos, Antonopoulos, and Rakopoulos (2007) and Rakopoulos et al.
(2008) carried out in-depth experimental investigations of the heat release
157
Temperature, °C
60
40
20
Butanol
Ethanol
blend µ - emulsion
0
–20
–40
Gasoline
Fuel
No. 1
diesel
No. 2
diesel
?
?
?
?
Figure 5.18
Flammability ranges of several fuels in the absence of forced ventilation. (From Boruff, P. A.,
Schwab, A. W., Goering, C. E., and Pryde, C. E., ASABE Transactions, 25, 47–53, 1982. Reprinted
with permission.)
et al. (2005) with the greatest being for the blend with the highest amount
of biofuel because of the high oxygen content. The NO x emissions tended to
increase while CO emissions were lower with the blends. In another study
by Merritt et al. (2005) involving three engines fitted with a rotary pump-line
nozzle, unit injector, and high pressure common rail fuel injection systems
respectively, smoke and PM emissions decreased with increasing ethanol
concentration in diesel fuel, but emissions of acetaldehyde increased. NO x
emissions improved with ethanol use in two of the engines, but not the
engine fitted with high pressure common rail injection system. Also CO
emissions were reduced in two of the three engines, the engine fitted with the
rotary pump-line nozzle system being the exception. The latter two results
highlighted the impact of fuel injection technology on engine response to
E-diesel blends.
Hansen, Zhang, and Lyne (2005) summarized the results of emissions tests
for CI engines running on ethanol–diesel blends of 10% and 15% ethanol
concentration, as shown in Table 5.7. The test engines varied considerably, as
shown in the table, and two different test procedures were used. Increased concentration of ethanol reduced the PM, carbon monoxide (CO), and unburned
hydrocarbon (HC) emissions but had no effect on the NO x emissions.
Rakopoulos, Antonopoulos, and Rakopoulos (2007) and Rakopoulos et al.
(2008) carried out in-depth experimental investigations of the heat release