

158
Alternative Fuels for Transportation
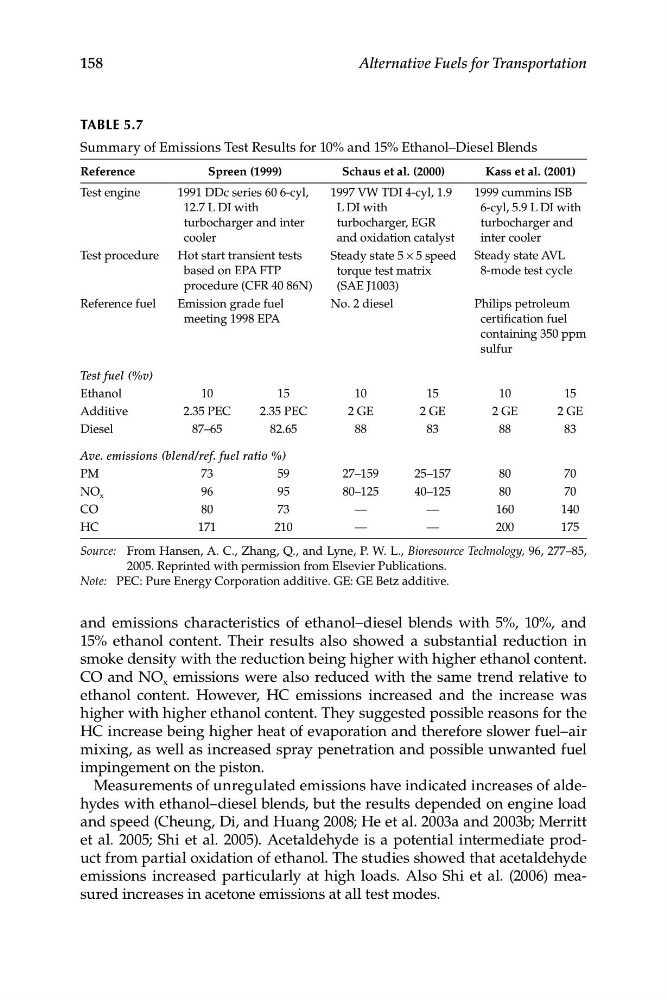
TABLe 5.7
Summary of Emissions Test Results for 10% and 15% Ethanol–Diesel Blends
Reference
Spreen (1999)
Schaus et al. (2000)
Kass et al. (2001)
Test engine
1991 DDc series 60 6-cyl,
1997 VW TDI 4-cyl, 1.9
1999 cummins ISB
12.7 L DI with
L DI with
6-cyl, 5.9 L DI with
turbocharger and inter
turbocharger, EGR
turbocharger and
cooler
and oxidation catalyst
inter cooler
Test procedure
Hot start transient tests
Steady state 5 × 5 speed
Steady state AVL
based on EPA FTP
torque test matrix
8-mode test cycle
procedure (CFR 40 86N)
(SAE J1003)
Reference fuel
Emission grade fuel
No. 2 diesel
Philips petroleum
meeting 1998 EPA
certification fuel
containing 350 ppm
sulfur
Test fuel (%v)
Ethanol
10
15
10
15
10
15
Additive
2.35 PEC
2.35 PEC
2 GE
2 GE
2 GE
2 GE
Diesel
87–65
82.65
88
83
88
83
Ave. emissions (blend/ref. fuel ratio %)
PM
73
59
27–159
25–157
80
70
NO x
96
95
80–125
40–125
80
70
CO
80
73
—
—
160
140
HC
171
210
—
—
200
175
Source: From Hansen, A. C., Zhang, Q., and Lyne, P. W. L., Bioresource Technology, 96, 277–85,
2005. Reprinted with permission from Elsevier Publications.
Note: PEC: Pure Energy Corporation additive. GE: GE Betz additive.
and emissions characteristics of ethanol–diesel blends with 5%, 10%, and
15% ethanol content. Their results also showed a substantial reduction in
smoke density with the reduction being higher with higher ethanol content.
CO and NO x emissions were also reduced with the same trend relative to
ethanol content. However, HC emissions increased and the increase was
higher with higher ethanol content. They suggested possible reasons for the
HC increase being higher heat of evaporation and therefore slower fuel–air
mixing, as well as increased spray penetration and possible unwanted fuel
impingement on the piston.
Measurements of unregulated emissions have indicated increases of aldehydes with ethanol–diesel blends, but the results depended on engine load
and speed (Cheung, Di, and Huang 2008; He et al. 2003a and 2003b; Merritt
et al. 2005; Shi et al. 2005). Acetaldehyde is a potential intermediate product from partial oxidation of ethanol. The studies showed that acetaldehyde
emissions increased particularly at high loads. Also Shi et al. (2006) measured increases in acetone emissions at all test modes.
Alternative Fuels for Transportation
TABLe 5.7
Summary of Emissions Test Results for 10% and 15% Ethanol–Diesel Blends
Reference
Spreen (1999)
Schaus et al. (2000)
Kass et al. (2001)
Test engine
1991 DDc series 60 6-cyl,
1997 VW TDI 4-cyl, 1.9
1999 cummins ISB
12.7 L DI with
L DI with
6-cyl, 5.9 L DI with
turbocharger and inter
turbocharger, EGR
turbocharger and
cooler
and oxidation catalyst
inter cooler
Test procedure
Hot start transient tests
Steady state 5 × 5 speed
Steady state AVL
based on EPA FTP
torque test matrix
8-mode test cycle
procedure (CFR 40 86N)
(SAE J1003)
Reference fuel
Emission grade fuel
No. 2 diesel
Philips petroleum
meeting 1998 EPA
certification fuel
containing 350 ppm
sulfur
Test fuel (%v)
Ethanol
10
15
10
15
10
15
Additive
2.35 PEC
2.35 PEC
2 GE
2 GE
2 GE
2 GE
Diesel
87–65
82.65
88
83
88
83
Ave. emissions (blend/ref. fuel ratio %)
PM
73
59
27–159
25–157
80
70
NO x
96
95
80–125
40–125
80
70
CO
80
73
—
—
160
140
HC
171
210
—
—
200
175
Source: From Hansen, A. C., Zhang, Q., and Lyne, P. W. L., Bioresource Technology, 96, 277–85,
2005. Reprinted with permission from Elsevier Publications.
Note: PEC: Pure Energy Corporation additive. GE: GE Betz additive.
and emissions characteristics of ethanol–diesel blends with 5%, 10%, and
15% ethanol content. Their results also showed a substantial reduction in
smoke density with the reduction being higher with higher ethanol content.
CO and NO x emissions were also reduced with the same trend relative to
ethanol content. However, HC emissions increased and the increase was
higher with higher ethanol content. They suggested possible reasons for the
HC increase being higher heat of evaporation and therefore slower fuel–air
mixing, as well as increased spray penetration and possible unwanted fuel
impingement on the piston.
Measurements of unregulated emissions have indicated increases of aldehydes with ethanol–diesel blends, but the results depended on engine load
and speed (Cheung, Di, and Huang 2008; He et al. 2003a and 2003b; Merritt
et al. 2005; Shi et al. 2005). Acetaldehyde is a potential intermediate product from partial oxidation of ethanol. The studies showed that acetaldehyde
emissions increased particularly at high loads. Also Shi et al. (2006) measured increases in acetone emissions at all test modes.