

142
Alternative Fuels for Transportation
E10
2000 rpm
Engine-out
80
70
60
50
40
30
20
10
0
0.20
0.32
0.48
Ethanol (ppm)
0.64
0.80
E30
BMEP (MPa)
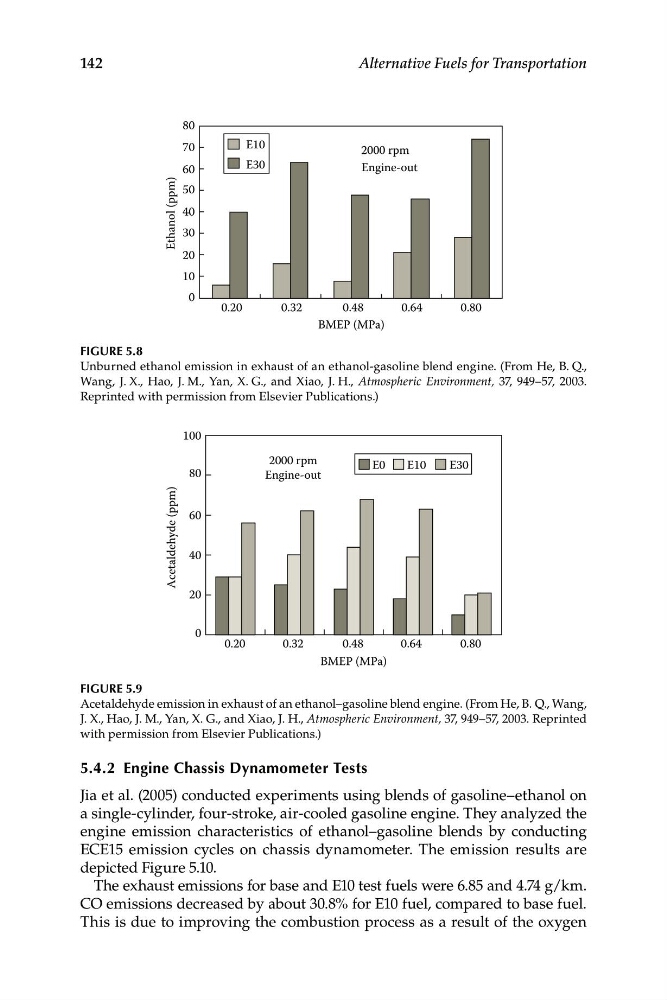
Figure 5.8
Unburned ethanol emission in exhaust of an ethanol-gasoline blend engine. (From He, B. Q.,
Wang, J. X., Hao, J. M., Yan, X. G., and Xiao, J. H., Atmospheric Environment, 37, 949–57, 2003.
Reprinted with permission from Elsevier Publications.)
0.20
0.32
0.48
0.64
0.80
100
E0
E10
E30
80
60
40
20
Acetaldehyde (ppm)
0
2000 rpm
Engine-out
BMEP (MPa)
Figure 5.9
Acetaldehyde emission in exhaust of an ethanol–gasoline blend engine. (From He, B. Q., Wang,
J. X., Hao, J. M., Yan, X. G., and Xiao, J. H., Atmospheric Environment, 37, 949–57, 2003. Reprinted
with permission from Elsevier Publications.)
5.4.2 engine Chassis Dynamometer Tests
Jia et al. (2005) conducted experiments using blends of gasoline–ethanol on
a single-cylinder, four-stroke, air-cooled gasoline engine. They analyzed the
engine emission characteristics of ethanol–gasoline blends by conducting
ECE15 emission cycles on chassis dynamometer. The emission results are
depicted Figure 5.10.
The exhaust emissions for base and E10 test fuels were 6.85 and 4.74 g/km.
CO emissions decreased by about 30.8% for E10 fuel, compared to base fuel.
This is due to improving the combustion process as a result of the oxygen
Alternative Fuels for Transportation
E10
2000 rpm
Engine-out
80
70
60
50
40
30
20
10
0
0.20
0.32
0.48
Ethanol (ppm)
0.64
0.80
E30
BMEP (MPa)
Figure 5.8
Unburned ethanol emission in exhaust of an ethanol-gasoline blend engine. (From He, B. Q.,
Wang, J. X., Hao, J. M., Yan, X. G., and Xiao, J. H., Atmospheric Environment, 37, 949–57, 2003.
Reprinted with permission from Elsevier Publications.)
0.20
0.32
0.48
0.64
0.80
100
E0
E10
E30
80
60
40
20
Acetaldehyde (ppm)
0
2000 rpm
Engine-out
BMEP (MPa)
Figure 5.9
Acetaldehyde emission in exhaust of an ethanol–gasoline blend engine. (From He, B. Q., Wang,
J. X., Hao, J. M., Yan, X. G., and Xiao, J. H., Atmospheric Environment, 37, 949–57, 2003. Reprinted
with permission from Elsevier Publications.)
5.4.2 engine Chassis Dynamometer Tests
Jia et al. (2005) conducted experiments using blends of gasoline–ethanol on
a single-cylinder, four-stroke, air-cooled gasoline engine. They analyzed the
engine emission characteristics of ethanol–gasoline blends by conducting
ECE15 emission cycles on chassis dynamometer. The emission results are
depicted Figure 5.10.
The exhaust emissions for base and E10 test fuels were 6.85 and 4.74 g/km.
CO emissions decreased by about 30.8% for E10 fuel, compared to base fuel.
This is due to improving the combustion process as a result of the oxygen