

H o
ydr carbons, ppm
220
200
180
160
140
120
1000 rpm
2000
3000
4000
0
5
10
15
20
25
30
Ethanol, %
%
100
75
50
25
0
CO
THC
E0
E10
E30
NO x
Ethanol
141
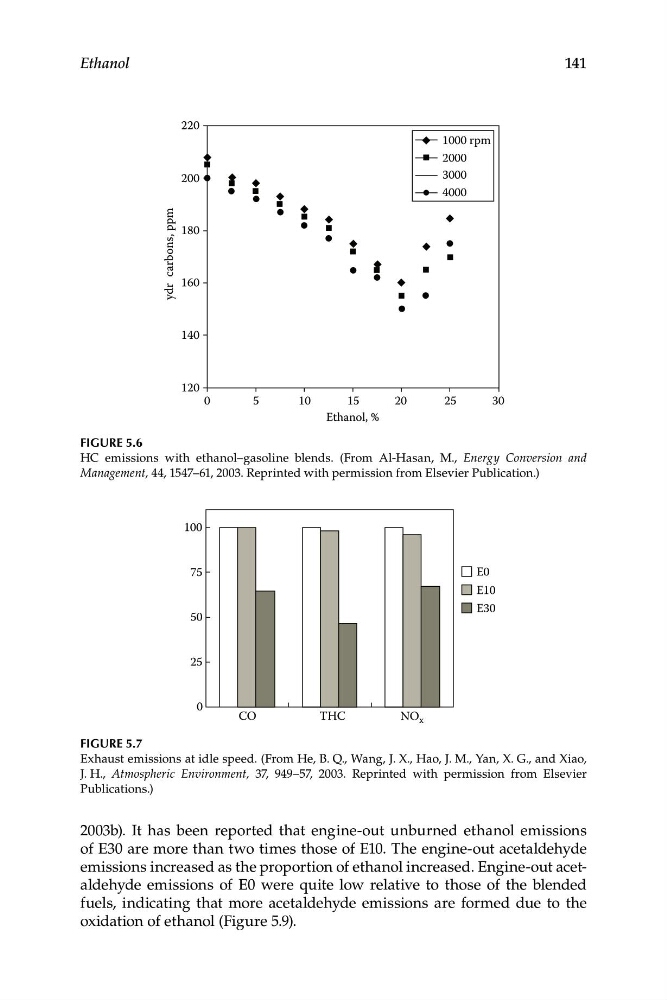
Figure 5.6
HC emissions with ethanol–gasoline blends. (From Al-Hasan, M., Energy Conversion and
Management, 44, 1547–61, 2003. Reprinted with permission from Elsevier Publication.)
Figure 5.7
Exhaust emissions at idle speed. (From He, B. Q., Wang, J. X., Hao, J. M., Yan, X. G., and Xiao,
J. H., Atmospheric Environment, 37, 949–57, 2003. Reprinted with permission from Elsevier
Publications.)
2003b). It has been reported that engine-out unburned ethanol emissions
of E30 are more than two times those of E10. The engine-out acetaldehyde
emissions increased as the proportion of ethanol increased. Engine-out acetaldehyde emissions of E0 were quite low relative to those of the blended
fuels, indicating that more acetaldehyde emissions are formed due to the
oxidation of ethanol (Figure 5.9).
ydr carbons, ppm
220
200
180
160
140
120
1000 rpm
2000
3000
4000
0
5
10
15
20
25
30
Ethanol, %
%
100
75
50
25
0
CO
THC
E0
E10
E30
NO x
Ethanol
141
Figure 5.6
HC emissions with ethanol–gasoline blends. (From Al-Hasan, M., Energy Conversion and
Management, 44, 1547–61, 2003. Reprinted with permission from Elsevier Publication.)
Figure 5.7
Exhaust emissions at idle speed. (From He, B. Q., Wang, J. X., Hao, J. M., Yan, X. G., and Xiao,
J. H., Atmospheric Environment, 37, 949–57, 2003. Reprinted with permission from Elsevier
Publications.)
2003b). It has been reported that engine-out unburned ethanol emissions
of E30 are more than two times those of E10. The engine-out acetaldehyde
emissions increased as the proportion of ethanol increased. Engine-out acetaldehyde emissions of E0 were quite low relative to those of the blended
fuels, indicating that more acetaldehyde emissions are formed due to the
oxidation of ethanol (Figure 5.9).