

228
Z. Wang et al.
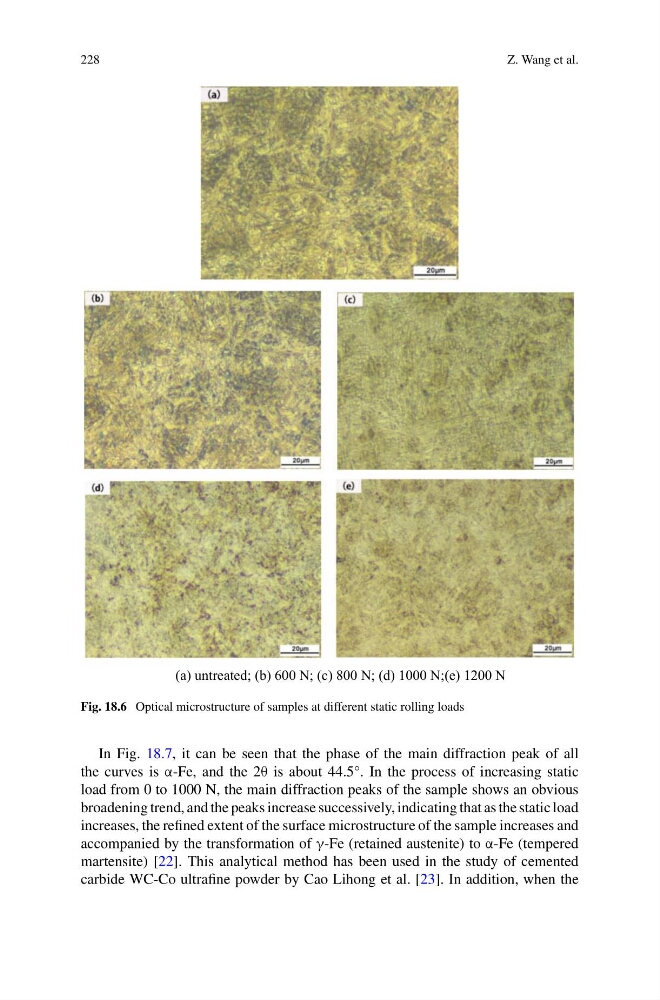
(a) untreated; (b) 600 N; (c) 800 N; (d) 1000 N;(e) 1200 N
Fig. 18.6 Optical microstructure of samples at different static rolling loads
In Fig. 18.7, it can be seen that the phase of the main diffraction peak of all
the curves is α-Fe, and the 2θ is about 44.5°. In the process of increasing static
load from 0 to 1000 N, the main diffraction peaks of the sample shows an obvious
broadening trend, and the peaks increase successively, indicating that as the static load
increases, the refined extent of the surface microstructure of the sample increases and
accompanied by the transformation of γ-Fe (retained austenite) to α-Fe (tempered
martensite) [22]. This analytical method has been used in the study of cemented
carbide WC-Co ultrafine powder by Cao Lihong et al. [23]. In addition, when the
Z. Wang et al.
(a) untreated; (b) 600 N; (c) 800 N; (d) 1000 N;(e) 1200 N
Fig. 18.6 Optical microstructure of samples at different static rolling loads
In Fig. 18.7, it can be seen that the phase of the main diffraction peak of all
the curves is α-Fe, and the 2θ is about 44.5°. In the process of increasing static
load from 0 to 1000 N, the main diffraction peaks of the sample shows an obvious
broadening trend, and the peaks increase successively, indicating that as the static load
increases, the refined extent of the surface microstructure of the sample increases and
accompanied by the transformation of γ-Fe (retained austenite) to α-Fe (tempered
martensite) [22]. This analytical method has been used in the study of cemented
carbide WC-Co ultrafine powder by Cao Lihong et al. [23]. In addition, when the