

224
Z. Wang et al.
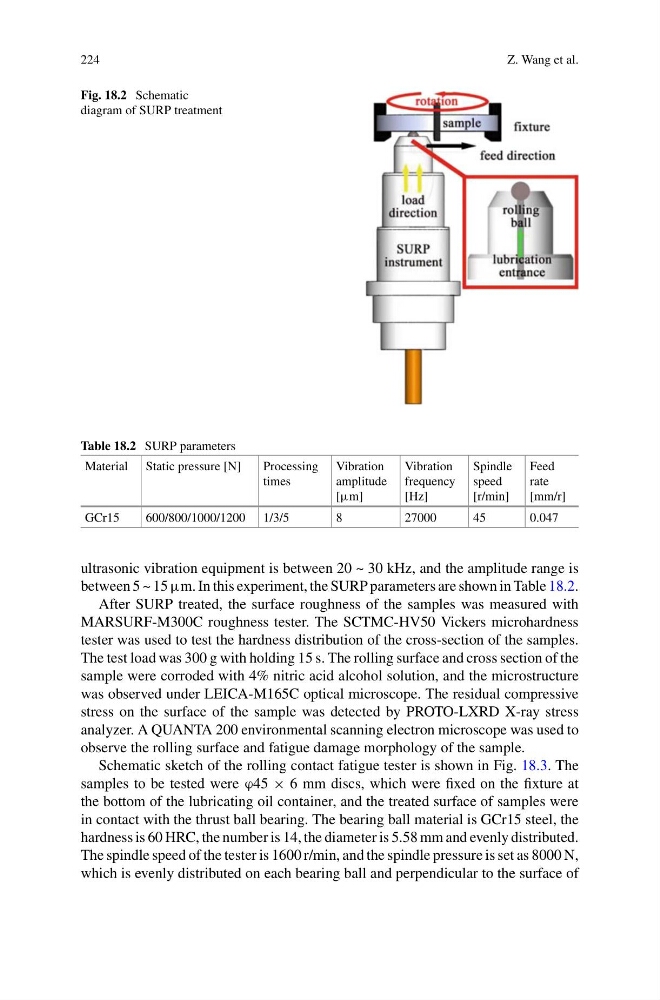
Fig. 18.2 Schematic
diagram of SURP treatment
Table 18.2 SURP parameters
Material Static pressure [N]
Processing
times
Vibration
amplitude
[μm]
Vibration
frequency
[Hz]
Spindle
speed
[r/min]
Feed
rate
[mm/r]
GCr15
600/800/1000/1200 1/3/5
8
27000
45
0.047
ultrasonic vibration equipment is between 20 ~ 30 kHz, and the amplitude range is
between 5 ~ 15 μm. In this experiment, the SURP parameters are shown in Table 18.2.
After SURP treated, the surface roughness of the samples was measured with
MARSURF-M300C roughness tester. The SCTMC-HV50 Vickers microhardness
tester was used to test the hardness distribution of the cross-section of the samples.
The test load was 300 g with holding 15 s. The rolling surface and cross section of the
sample were corroded with 4% nitric acid alcohol solution, and the microstructure
was observed under LEICA-M165C optical microscope. The residual compressive
stress on the surface of the sample was detected by PROTO-LXRD X-ray stress
analyzer. A QUANTA 200 environmental scanning electron microscope was used to
observe the rolling surface and fatigue damage morphology of the sample.
Schematic sketch of the rolling contact fatigue tester is shown in Fig. 18.3. The
samples to be tested were ϕ45 × 6 mm discs, which were fixed on the fixture at
the bottom of the lubricating oil container, and the treated surface of samples were
in contact with the thrust ball bearing. The bearing ball material is GCr15 steel, the
hardness is 60 HRC, the number is 14, the diameter is 5.58 mm and evenly distributed.
The spindle speed of the tester is 1600 r/min, and the spindle pressure is set as 8000 N,
which is evenly distributed on each bearing ball and perpendicular to the surface of
Z. Wang et al.
Fig. 18.2 Schematic
diagram of SURP treatment
Table 18.2 SURP parameters
Material Static pressure [N]
Processing
times
Vibration
amplitude
[μm]
Vibration
frequency
[Hz]
Spindle
speed
[r/min]
Feed
rate
[mm/r]
GCr15
600/800/1000/1200 1/3/5
8
27000
45
0.047
ultrasonic vibration equipment is between 20 ~ 30 kHz, and the amplitude range is
between 5 ~ 15 μm. In this experiment, the SURP parameters are shown in Table 18.2.
After SURP treated, the surface roughness of the samples was measured with
MARSURF-M300C roughness tester. The SCTMC-HV50 Vickers microhardness
tester was used to test the hardness distribution of the cross-section of the samples.
The test load was 300 g with holding 15 s. The rolling surface and cross section of the
sample were corroded with 4% nitric acid alcohol solution, and the microstructure
was observed under LEICA-M165C optical microscope. The residual compressive
stress on the surface of the sample was detected by PROTO-LXRD X-ray stress
analyzer. A QUANTA 200 environmental scanning electron microscope was used to
observe the rolling surface and fatigue damage morphology of the sample.
Schematic sketch of the rolling contact fatigue tester is shown in Fig. 18.3. The
samples to be tested were ϕ45 × 6 mm discs, which were fixed on the fixture at
the bottom of the lubricating oil container, and the treated surface of samples were
in contact with the thrust ball bearing. The bearing ball material is GCr15 steel, the
hardness is 60 HRC, the number is 14, the diameter is 5.58 mm and evenly distributed.
The spindle speed of the tester is 1600 r/min, and the spindle pressure is set as 8000 N,
which is evenly distributed on each bearing ball and perpendicular to the surface of