

10
Y. Wang and Y. Zeng
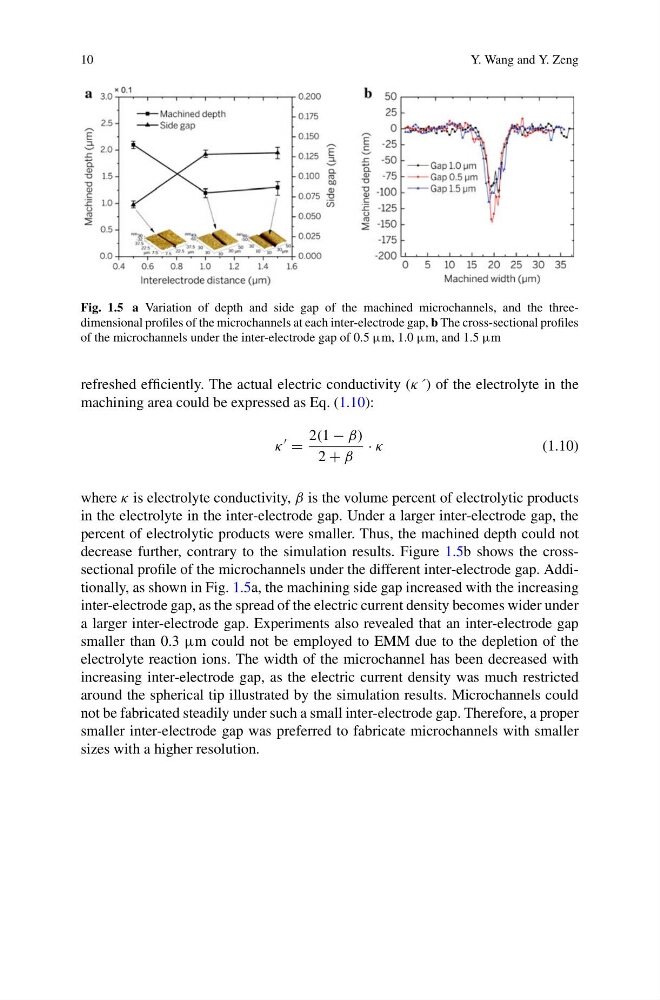
Fig. 1.5 a Variation of depth and side gap of the machined microchannels, and the threedimensional profiles of the microchannels at each inter-electrode gap, b The cross-sectional profiles
of the microchannels under the inter-electrode gap of 0.5 μm, 1.0 μm, and 1.5 μm
refreshed efficiently. The actual electric conductivity (κ´ ) of the electrolyte in the
machining area could be expressed as Eq. (1.10):
κ
=
2(1 − β)
2 + β
· κ
(1.10)
where κ is electrolyte conductivity, β is the volume percent of electrolytic products
in the electrolyte in the inter-electrode gap. Under a larger inter-electrode gap, the
percent of electrolytic products were smaller. Thus, the machined depth could not
decrease further, contrary to the simulation results. Figure 1.5b shows the crosssectional profile of the microchannels under the different inter-electrode gap. Additionally, as shown in Fig. 1.5a, the machining side gap increased with the increasing
inter-electrode gap, as the spread of the electric current density becomes wider under
a larger inter-electrode gap. Experiments also revealed that an inter-electrode gap
smaller than 0.3 μm could not be employed to EMM due to the depletion of the
electrolyte reaction ions. The width of the microchannel has been decreased with
increasing inter-electrode gap, as the electric current density was much restricted
around the spherical tip illustrated by the simulation results. Microchannels could
not be fabricated steadily under such a small inter-electrode gap. Therefore, a proper
smaller inter-electrode gap was preferred to fabricate microchannels with smaller
sizes with a higher resolution.
Y. Wang and Y. Zeng
Fig. 1.5 a Variation of depth and side gap of the machined microchannels, and the threedimensional profiles of the microchannels at each inter-electrode gap, b The cross-sectional profiles
of the microchannels under the inter-electrode gap of 0.5 μm, 1.0 μm, and 1.5 μm
refreshed efficiently. The actual electric conductivity (κ´ ) of the electrolyte in the
machining area could be expressed as Eq. (1.10):
κ
=
2(1 − β)
2 + β
· κ
(1.10)
where κ is electrolyte conductivity, β is the volume percent of electrolytic products
in the electrolyte in the inter-electrode gap. Under a larger inter-electrode gap, the
percent of electrolytic products were smaller. Thus, the machined depth could not
decrease further, contrary to the simulation results. Figure 1.5b shows the crosssectional profile of the microchannels under the different inter-electrode gap. Additionally, as shown in Fig. 1.5a, the machining side gap increased with the increasing
inter-electrode gap, as the spread of the electric current density becomes wider under
a larger inter-electrode gap. Experiments also revealed that an inter-electrode gap
smaller than 0.3 μm could not be employed to EMM due to the depletion of the
electrolyte reaction ions. The width of the microchannel has been decreased with
increasing inter-electrode gap, as the electric current density was much restricted
around the spherical tip illustrated by the simulation results. Microchannels could
not be fabricated steadily under such a small inter-electrode gap. Therefore, a proper
smaller inter-electrode gap was preferred to fabricate microchannels with smaller
sizes with a higher resolution.