

178
Z. Liu et al.
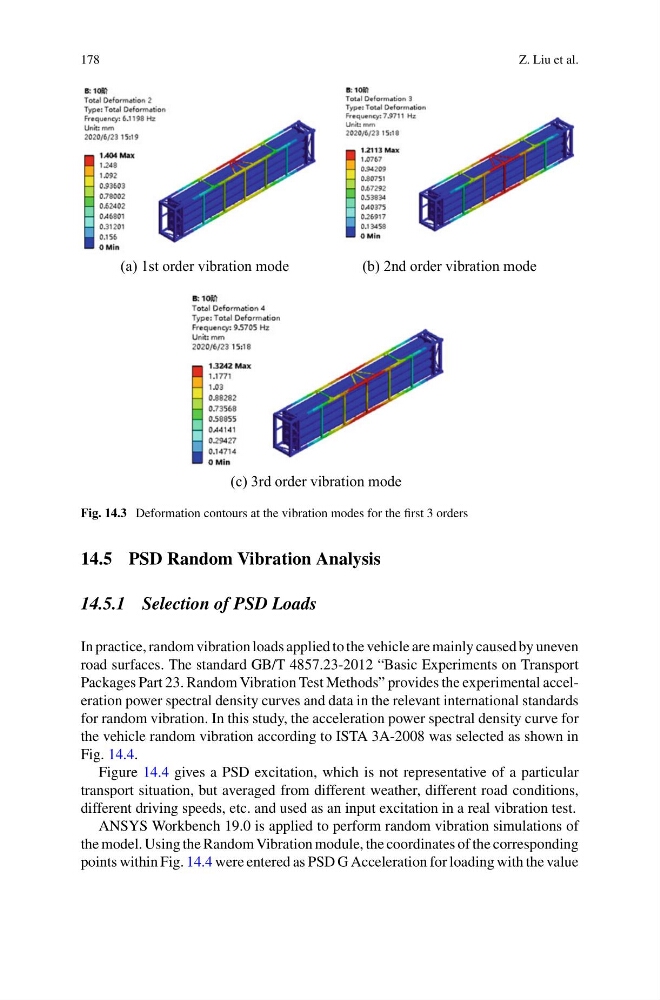
(a) 1st order vibration mode
(b) 2nd order vibration mode
(c) 3rd order vibration mode
Fig. 14.3 Deformation contours at the vibration modes for the first 3 orders
14.5 PSD Random Vibration Analysis
14.5.1 Selection of PSD Loads
In practice, random vibration loads applied to the vehicle are mainly caused by uneven
road surfaces. The standard GB/T 4857.23-2012 “Basic Experiments on Transport
Packages Part 23. Random Vibration Test Methods” provides the experimental acceleration power spectral density curves and data in the relevant international standards
for random vibration. In this study, the acceleration power spectral density curve for
the vehicle random vibration according to ISTA 3A-2008 was selected as shown in
Fig. 14.4.
Figure 14.4 gives a PSD excitation, which is not representative of a particular
transport situation, but averaged from different weather, different road conditions,
different driving speeds, etc. and used as an input excitation in a real vibration test.
ANSYS Workbench 19.0 is applied to perform random vibration simulations of
the model. Using the Random Vibration module, the coordinates of the corresponding
points within Fig. 14.4 were entered as PSD G Acceleration for loading with the value
Z. Liu et al.
(a) 1st order vibration mode
(b) 2nd order vibration mode
(c) 3rd order vibration mode
Fig. 14.3 Deformation contours at the vibration modes for the first 3 orders
14.5 PSD Random Vibration Analysis
14.5.1 Selection of PSD Loads
In practice, random vibration loads applied to the vehicle are mainly caused by uneven
road surfaces. The standard GB/T 4857.23-2012 “Basic Experiments on Transport
Packages Part 23. Random Vibration Test Methods” provides the experimental acceleration power spectral density curves and data in the relevant international standards
for random vibration. In this study, the acceleration power spectral density curve for
the vehicle random vibration according to ISTA 3A-2008 was selected as shown in
Fig. 14.4.
Figure 14.4 gives a PSD excitation, which is not representative of a particular
transport situation, but averaged from different weather, different road conditions,
different driving speeds, etc. and used as an input excitation in a real vibration test.
ANSYS Workbench 19.0 is applied to perform random vibration simulations of
the model. Using the Random Vibration module, the coordinates of the corresponding
points within Fig. 14.4 were entered as PSD G Acceleration for loading with the value