

14 PSD Random Vibration Strength and Fatigue Analysis …
179
Fig. 14.4 Random vibration
PSD curves for model
loading
of the modal damping ratio being taken as 0.01. von Mises stress was obtained for
the results.
14.5.2 Strength Analysis
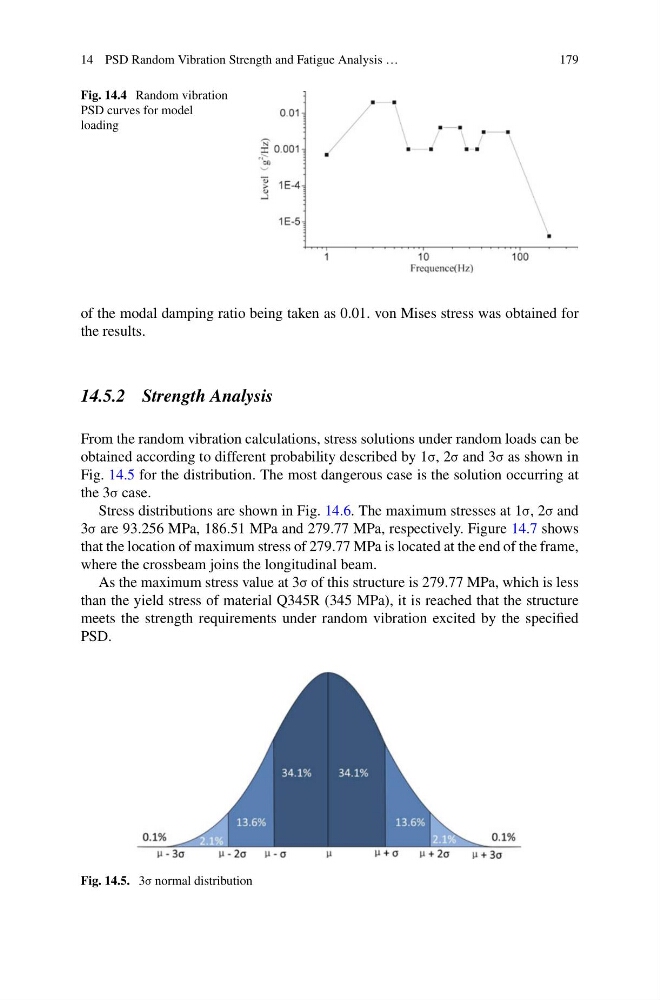
From the random vibration calculations, stress solutions under random loads can be
obtained according to different probability described by 1σ, 2σ and 3σ as shown in
Fig. 14.5 for the distribution. The most dangerous case is the solution occurring at
the 3σ case.
Stress distributions are shown in Fig. 14.6. The maximum stresses at 1σ, 2σ and
3σ are 93.256 MPa, 186.51 MPa and 279.77 MPa, respectively. Figure 14.7 shows
that the location of maximum stress of 279.77 MPa is located at the end of the frame,
where the crossbeam joins the longitudinal beam.
As the maximum stress value at 3σ of this structure is 279.77 MPa, which is less
than the yield stress of material Q345R (345 MPa), it is reached that the structure
meets the strength requirements under random vibration excited by the specified
PSD.
Fig. 14.5. 3σ normal distribution
179
Fig. 14.4 Random vibration
PSD curves for model
loading
of the modal damping ratio being taken as 0.01. von Mises stress was obtained for
the results.
14.5.2 Strength Analysis
From the random vibration calculations, stress solutions under random loads can be
obtained according to different probability described by 1σ, 2σ and 3σ as shown in
Fig. 14.5 for the distribution. The most dangerous case is the solution occurring at
the 3σ case.
Stress distributions are shown in Fig. 14.6. The maximum stresses at 1σ, 2σ and
3σ are 93.256 MPa, 186.51 MPa and 279.77 MPa, respectively. Figure 14.7 shows
that the location of maximum stress of 279.77 MPa is located at the end of the frame,
where the crossbeam joins the longitudinal beam.
As the maximum stress value at 3σ of this structure is 279.77 MPa, which is less
than the yield stress of material Q345R (345 MPa), it is reached that the structure
meets the strength requirements under random vibration excited by the specified
PSD.
Fig. 14.5. 3σ normal distribution