

96
Z. Liu et al.
into transient data fluctuations to study the sensitivity of fatigue strength to input
parameters, including temperature and pressure.
Transient fluctuations are considered that temperature and pressure data points
obey a normal distribution within a certain range. In order to process transient data
efficiently, each transient is processed into dimensionless variables. In other words,
the value of each data point is divided by the first data point of each transient.
Finally, 10 temperature–time curves and 5 pressure–time curves are obtained after
the process.
Taking the first data point as an example, the uncertainty quantization assumed
in this paper of the parameters is shown in Table 8.2.
The above parameters are sampled using Monte Carlo method. The Latin square
sampling method is chosen to avoid sample point repetition, and the sampling
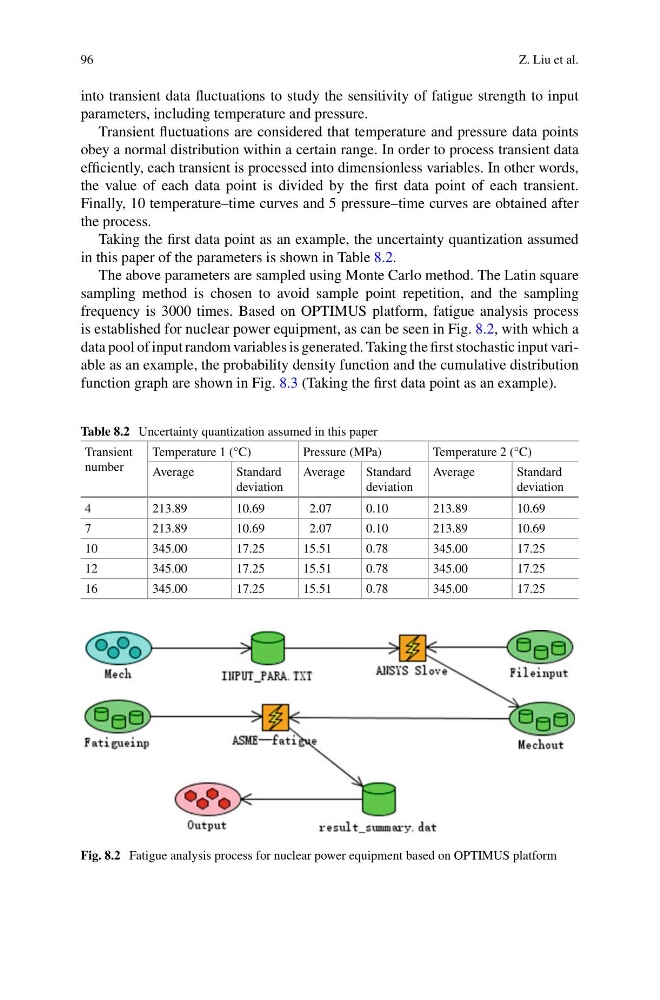
frequency is 3000 times. Based on OPTIMUS platform, fatigue analysis process
is established for nuclear power equipment, as can be seen in Fig. 8.2, with which a
data pool of input random variables is generated. Taking the first stochastic input variable as an example, the probability density function and the cumulative distribution
function graph are shown in Fig. 8.3 (Taking the first data point as an example).
Table 8.2 Uncertainty quantization assumed in this paper
Transient
number
Temperature 1 (°C)
Pressure (MPa)
Temperature 2 (°C)
Average
Standard
deviation
Average
Standard
deviation
Average
Standard
deviation
4
213.89
10.69
2.07
0.10
213.89
10.69
7
213.89
10.69
2.07
0.10
213.89
10.69
10
345.00
17.25
15.51
0.78
345.00
17.25
12
345.00
17.25
15.51
0.78
345.00
17.25
16
345.00
17.25
15.51
0.78
345.00
17.25
Fig. 8.2 Fatigue analysis process for nuclear power equipment based on OPTIMUS platform
Z. Liu et al.
into transient data fluctuations to study the sensitivity of fatigue strength to input
parameters, including temperature and pressure.
Transient fluctuations are considered that temperature and pressure data points
obey a normal distribution within a certain range. In order to process transient data
efficiently, each transient is processed into dimensionless variables. In other words,
the value of each data point is divided by the first data point of each transient.
Finally, 10 temperature–time curves and 5 pressure–time curves are obtained after
the process.
Taking the first data point as an example, the uncertainty quantization assumed
in this paper of the parameters is shown in Table 8.2.
The above parameters are sampled using Monte Carlo method. The Latin square
sampling method is chosen to avoid sample point repetition, and the sampling
frequency is 3000 times. Based on OPTIMUS platform, fatigue analysis process
is established for nuclear power equipment, as can be seen in Fig. 8.2, with which a
data pool of input random variables is generated. Taking the first stochastic input variable as an example, the probability density function and the cumulative distribution
function graph are shown in Fig. 8.3 (Taking the first data point as an example).
Table 8.2 Uncertainty quantization assumed in this paper
Transient
number
Temperature 1 (°C)
Pressure (MPa)
Temperature 2 (°C)
Average
Standard
deviation
Average
Standard
deviation
Average
Standard
deviation
4
213.89
10.69
2.07
0.10
213.89
10.69
7
213.89
10.69
2.07
0.10
213.89
10.69
10
345.00
17.25
15.51
0.78
345.00
17.25
12
345.00
17.25
15.51
0.78
345.00
17.25
16
345.00
17.25
15.51
0.78
345.00
17.25
Fig. 8.2 Fatigue analysis process for nuclear power equipment based on OPTIMUS platform