

8 Uncertainty Quantification of Spray Nozzle Fatigue …
97
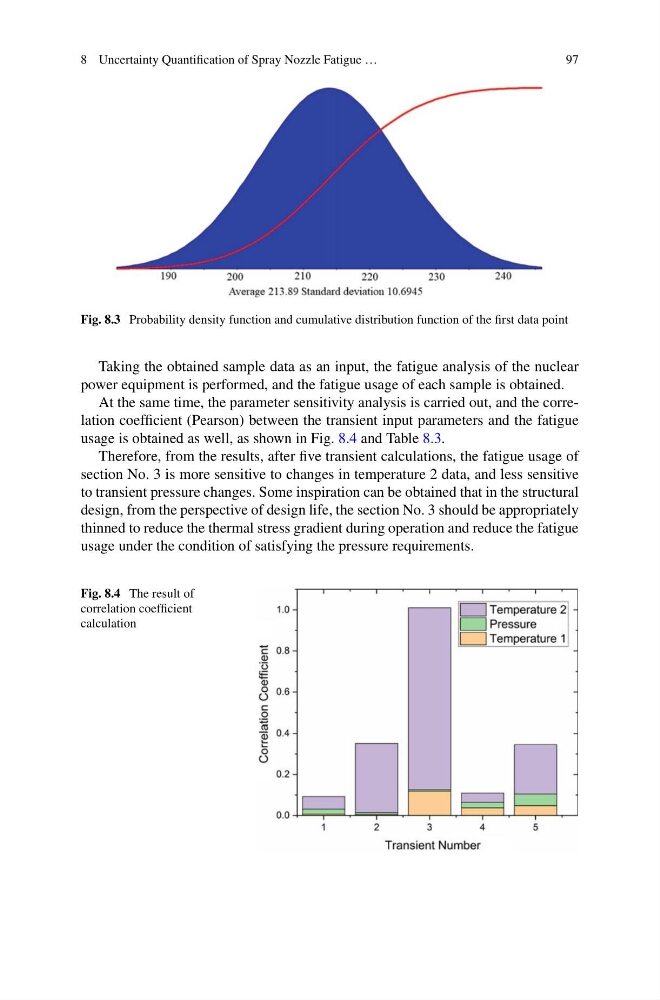
Fig. 8.3 Probability density function and cumulative distribution function of the first data point
Taking the obtained sample data as an input, the fatigue analysis of the nuclear
power equipment is performed, and the fatigue usage of each sample is obtained.
At the same time, the parameter sensitivity analysis is carried out, and the correlation coefficient (Pearson) between the transient input parameters and the fatigue
usage is obtained as well, as shown in Fig. 8.4 and Table 8.3.
Therefore, from the results, after five transient calculations, the fatigue usage of
section No. 3 is more sensitive to changes in temperature 2 data, and less sensitive
to transient pressure changes. Some inspiration can be obtained that in the structural
design, from the perspective of design life, the section No. 3 should be appropriately
thinned to reduce the thermal stress gradient during operation and reduce the fatigue
usage under the condition of satisfying the pressure requirements.
Fig. 8.4 The result of
correlation coefficient
calculation
97
Fig. 8.3 Probability density function and cumulative distribution function of the first data point
Taking the obtained sample data as an input, the fatigue analysis of the nuclear
power equipment is performed, and the fatigue usage of each sample is obtained.
At the same time, the parameter sensitivity analysis is carried out, and the correlation coefficient (Pearson) between the transient input parameters and the fatigue
usage is obtained as well, as shown in Fig. 8.4 and Table 8.3.
Therefore, from the results, after five transient calculations, the fatigue usage of
section No. 3 is more sensitive to changes in temperature 2 data, and less sensitive
to transient pressure changes. Some inspiration can be obtained that in the structural
design, from the perspective of design life, the section No. 3 should be appropriately
thinned to reduce the thermal stress gradient during operation and reduce the fatigue
usage under the condition of satisfying the pressure requirements.
Fig. 8.4 The result of
correlation coefficient
calculation