

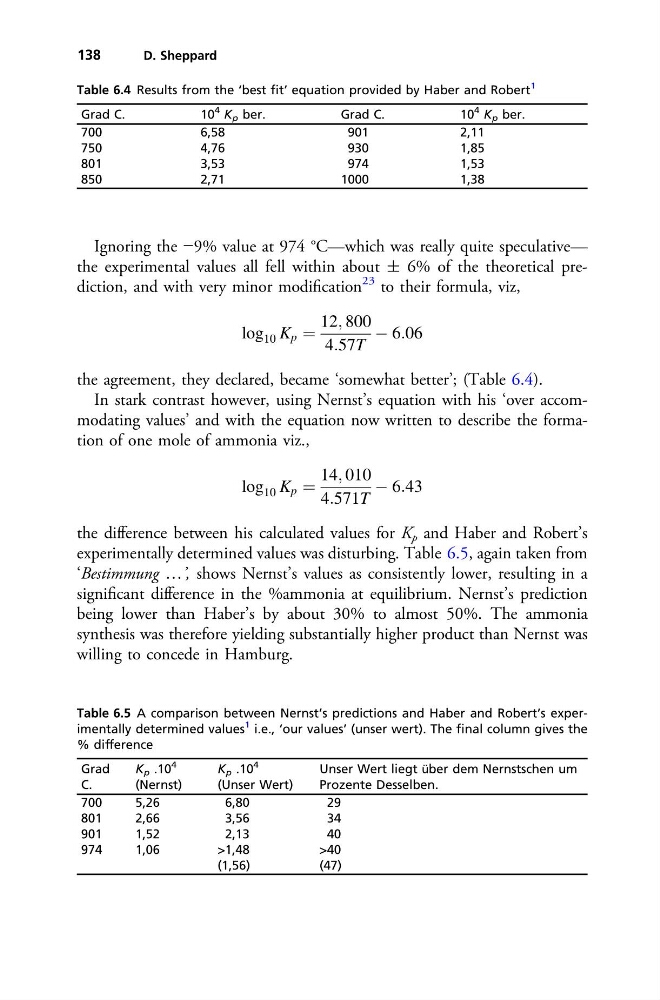
Ignoring the −9% value at 974 °C—which was really quite speculative—
the experimental values all fell within about ± 6% of the theoretical prediction, and with very minor modification
23 to their formula, viz,
log 10 K p ¼
12; 800
4:57T
À 6:06
the agreement, they declared, became ‘somewhat better’; (Table 6.4).
In stark contrast however, using Nernst’s equation with his ‘over accommodating values’ and with the equation now written to describe the formation of one mole of ammonia viz.,
log 10 K p ¼
14; 010
4:571T
À 6:43
the difference between his calculated values for K p and Haber and Robert’s
experimentally determined values was disturbing. Table 6.5, again taken from
‘Bestimmung …’, shows Nernst’s values as consistently lower, resulting in a
significant difference in the %ammonia at equilibrium. Nernst’s prediction
being lower than Haber’s by about 30% to almost 50%. The ammonia
synthesis was therefore yielding substantially higher product than Nernst was
willing to concede in Hamburg.
Table 6.4 Results from the ‘best fit’ equation provided by Haber and Robert
1
Grad C.
10
4 K p ber.
Grad C.
10
4 K p ber.
700
6,58
901
2,11
750
4,76
930
1,85
801
3,53
974
1,53
850
2,71
1000
1,38
Table 6.5 A comparison between Nernst’s predictions and Haber and Robert’s experimentally determined values
1 i.e., ‘our values’ (unser wert). The final column gives the
% difference
Grad
C.
K p .10
4
(Nernst)
K p .10
4
(Unser Wert)
Unser Wert liegt über dem Nernstschen um
Prozente Desselben.
700
5,26
6,80
29
801
2,66
3,56
34
901
1,52
2,13
40
974
1,06
>1,48
(1,56)
>40
(47)
138
D. Sheppard
the experimental values all fell within about ± 6% of the theoretical prediction, and with very minor modification
23 to their formula, viz,
log 10 K p ¼
12; 800
4:57T
À 6:06
the agreement, they declared, became ‘somewhat better’; (Table 6.4).
In stark contrast however, using Nernst’s equation with his ‘over accommodating values’ and with the equation now written to describe the formation of one mole of ammonia viz.,
log 10 K p ¼
14; 010
4:571T
À 6:43
the difference between his calculated values for K p and Haber and Robert’s
experimentally determined values was disturbing. Table 6.5, again taken from
‘Bestimmung …’, shows Nernst’s values as consistently lower, resulting in a
significant difference in the %ammonia at equilibrium. Nernst’s prediction
being lower than Haber’s by about 30% to almost 50%. The ammonia
synthesis was therefore yielding substantially higher product than Nernst was
willing to concede in Hamburg.
Table 6.4 Results from the ‘best fit’ equation provided by Haber and Robert
1
Grad C.
10
4 K p ber.
Grad C.
10
4 K p ber.
700
6,58
901
2,11
750
4,76
930
1,85
801
3,53
974
1,53
850
2,71
1000
1,38
Table 6.5 A comparison between Nernst’s predictions and Haber and Robert’s experimentally determined values
1 i.e., ‘our values’ (unser wert). The final column gives the
% difference
Grad
C.
K p .10
4
(Nernst)
K p .10
4
(Unser Wert)
Unser Wert liegt über dem Nernstschen um
Prozente Desselben.
700
5,26
6,80
29
801
2,66
3,56
34
901
1,52
2,13
40
974
1,06
>1,48
(1,56)
>40
(47)
138
D. Sheppard