

56
2 Description of the Wolfram SystemModeler
In the Experiment Browser window, you can specify simulation settings, parameter values, as well as initial values for variables. But we will leave the default settings
for now by clicking the Simulate button instead to start the simulation.
After performing the simulation of our model, you need to go to the chart view
on the Plot tab.
Now, we are interested in time dependencies, as shown in Fig. 2.30.
Check the box opposite the variable x to build the resulting graph, as is done in
Fig. 2.14. Then, we will see how the variable we choose changes over time.
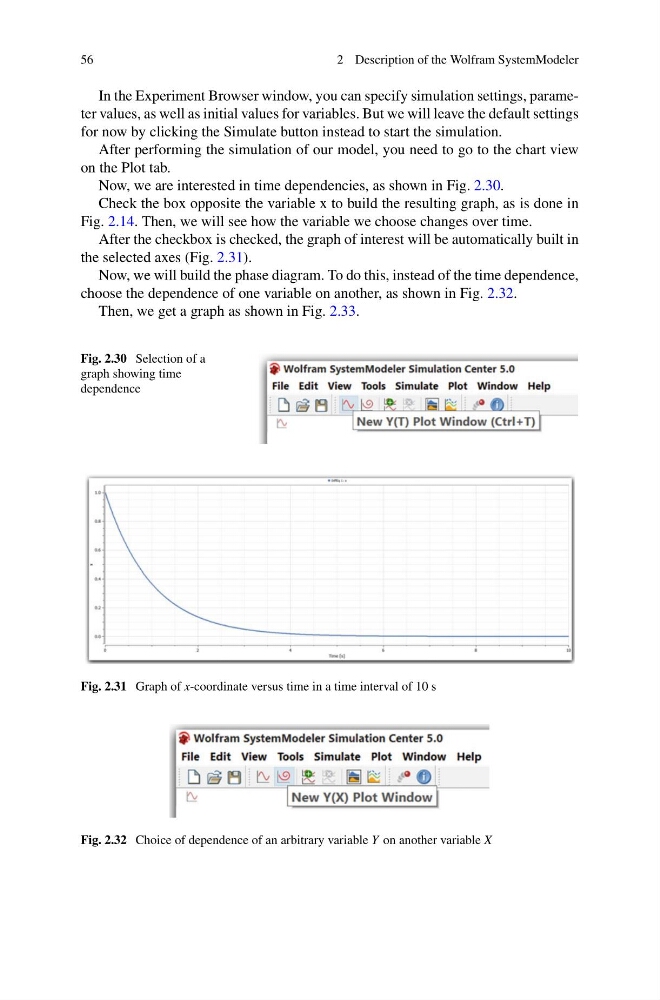
After the checkbox is checked, the graph of interest will be automatically built in
the selected axes (Fig. 2.31).
Now, we will build the phase diagram. To do this, instead of the time dependence,
choose the dependence of one variable on another, as shown in Fig. 2.32.
Then, we get a graph as shown in Fig. 2.33.
Fig. 2.30 Selection of a
graph showing time
dependence
Fig. 2.31 Graph of x-coordinate versus time in a time interval of 10 s
Fig. 2.32 Choice of dependence of an arbitrary variable Y on another variable X
2 Description of the Wolfram SystemModeler
In the Experiment Browser window, you can specify simulation settings, parameter values, as well as initial values for variables. But we will leave the default settings
for now by clicking the Simulate button instead to start the simulation.
After performing the simulation of our model, you need to go to the chart view
on the Plot tab.
Now, we are interested in time dependencies, as shown in Fig. 2.30.
Check the box opposite the variable x to build the resulting graph, as is done in
Fig. 2.14. Then, we will see how the variable we choose changes over time.
After the checkbox is checked, the graph of interest will be automatically built in
the selected axes (Fig. 2.31).
Now, we will build the phase diagram. To do this, instead of the time dependence,
choose the dependence of one variable on another, as shown in Fig. 2.32.
Then, we get a graph as shown in Fig. 2.33.
Fig. 2.30 Selection of a
graph showing time
dependence
Fig. 2.31 Graph of x-coordinate versus time in a time interval of 10 s
Fig. 2.32 Choice of dependence of an arbitrary variable Y on another variable X