

2.3 Simulation Center
41
2.3.3 Plotting
After you have prepared the initial data for the experiment, the “Plot” tab contains all
the necessary variables and parameters of the experiment. They are presented in the
form of a tree, which is built hierarchically with components in the form of branches.
Double-click the component name to expand or collapse its branch. By expanding
a branch, you can access the variables and parameters of the corresponding component. Each variable and parameter have a checkbox for selecting this element for
plotting.
There are two different graphing modes:
• the plotting mode Y (T ), which is used to plot the dependence of variables and
parameters on time (normal time schedules);
• the plotting mode Y (X), which is used to plot the dependence of a variable or
parameter on another variable or parameter (so-called phase diagrams).
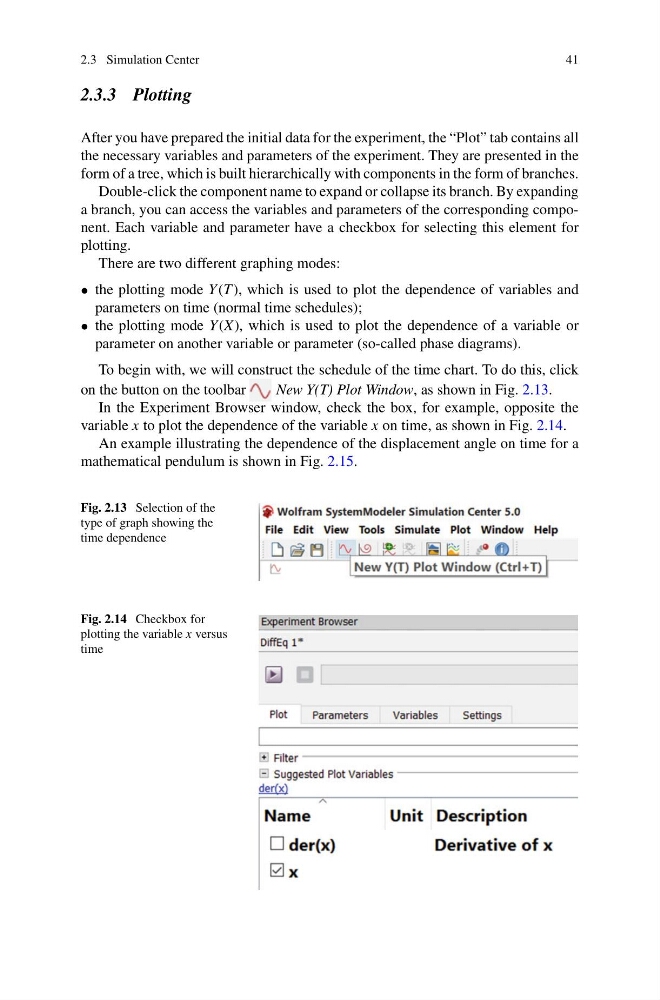
To begin with, we will construct the schedule of the time chart. To do this, click
on the button on the toolbar
New Y(T) Plot Window, as shown in Fig. 2.13.
In the Experiment Browser window, check the box, for example, opposite the
variable x to plot the dependence of the variable x on time, as shown in Fig. 2.14.
An example illustrating the dependence of the displacement angle on time for a
mathematical pendulum is shown in Fig. 2.15.
Fig. 2.13 Selection of the
type of graph showing the
time dependence
Fig. 2.14 Checkbox for
plotting the variable x versus
time
41
2.3.3 Plotting
After you have prepared the initial data for the experiment, the “Plot” tab contains all
the necessary variables and parameters of the experiment. They are presented in the
form of a tree, which is built hierarchically with components in the form of branches.
Double-click the component name to expand or collapse its branch. By expanding
a branch, you can access the variables and parameters of the corresponding component. Each variable and parameter have a checkbox for selecting this element for
plotting.
There are two different graphing modes:
• the plotting mode Y (T ), which is used to plot the dependence of variables and
parameters on time (normal time schedules);
• the plotting mode Y (X), which is used to plot the dependence of a variable or
parameter on another variable or parameter (so-called phase diagrams).
To begin with, we will construct the schedule of the time chart. To do this, click
on the button on the toolbar
New Y(T) Plot Window, as shown in Fig. 2.13.
In the Experiment Browser window, check the box, for example, opposite the
variable x to plot the dependence of the variable x on time, as shown in Fig. 2.14.
An example illustrating the dependence of the displacement angle on time for a
mathematical pendulum is shown in Fig. 2.15.
Fig. 2.13 Selection of the
type of graph showing the
time dependence
Fig. 2.14 Checkbox for
plotting the variable x versus
time