

42
2 Description of the Wolfram SystemModeler
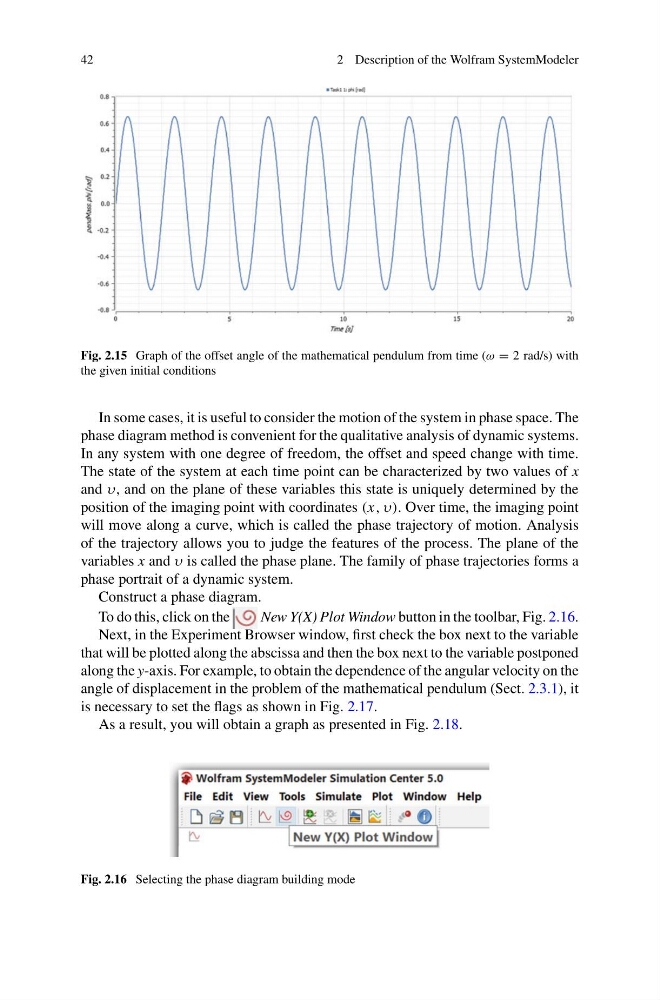
Fig. 2.15 Graph of the offset angle of the mathematical pendulum from time (ω = 2 rad/s) with
the given initial conditions
In some cases, it is useful to consider the motion of the system in phase space. The
phase diagram method is convenient for the qualitative analysis of dynamic systems.
In any system with one degree of freedom, the offset and speed change with time.
The state of the system at each time point can be characterized by two values of x
and υ, and on the plane of these variables this state is uniquely determined by the
position of the imaging point with coordinates (x, υ). Over time, the imaging point
will move along a curve, which is called the phase trajectory of motion. Analysis
of the trajectory allows you to judge the features of the process. The plane of the
variables x and υ is called the phase plane. The family of phase trajectories forms a
phase portrait of a dynamic system.
Construct a phase diagram.
To do this, click on the
New Y(X) Plot Window button in the toolbar, Fig. 2.16.
Next, in the Experiment Browser window, first check the box next to the variable
that will be plotted along the abscissa and then the box next to the variable postponed
along the y-axis. For example, to obtain the dependence of the angular velocity on the
angle of displacement in the problem of the mathematical pendulum (Sect. 2.3.1), it
is necessary to set the flags as shown in Fig. 2.17.
As a result, you will obtain a graph as presented in Fig. 2.18.
Fig. 2.16 Selecting the phase diagram building mode
2 Description of the Wolfram SystemModeler
Fig. 2.15 Graph of the offset angle of the mathematical pendulum from time (ω = 2 rad/s) with
the given initial conditions
In some cases, it is useful to consider the motion of the system in phase space. The
phase diagram method is convenient for the qualitative analysis of dynamic systems.
In any system with one degree of freedom, the offset and speed change with time.
The state of the system at each time point can be characterized by two values of x
and υ, and on the plane of these variables this state is uniquely determined by the
position of the imaging point with coordinates (x, υ). Over time, the imaging point
will move along a curve, which is called the phase trajectory of motion. Analysis
of the trajectory allows you to judge the features of the process. The plane of the
variables x and υ is called the phase plane. The family of phase trajectories forms a
phase portrait of a dynamic system.
Construct a phase diagram.
To do this, click on the
New Y(X) Plot Window button in the toolbar, Fig. 2.16.
Next, in the Experiment Browser window, first check the box next to the variable
that will be plotted along the abscissa and then the box next to the variable postponed
along the y-axis. For example, to obtain the dependence of the angular velocity on the
angle of displacement in the problem of the mathematical pendulum (Sect. 2.3.1), it
is necessary to set the flags as shown in Fig. 2.17.
As a result, you will obtain a graph as presented in Fig. 2.18.
Fig. 2.16 Selecting the phase diagram building mode