

230
6 Hierarchical Component Models
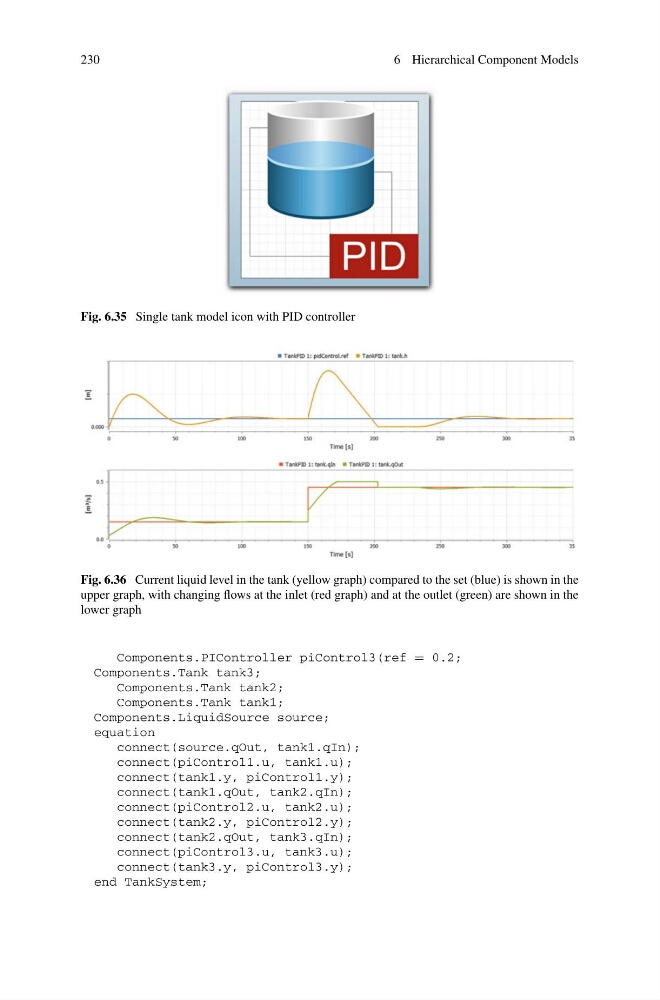
Fig. 6.35 Single tank model icon with PID controller
Fig. 6.36 Current liquid level in the tank (yellow graph) compared to the set (blue) is shown in the
upper graph, with changing flows at the inlet (red graph) and at the outlet (green) are shown in the
lower graph
Components.PIController piControl3(ref = 0.2;
Components.Tank tank3;
Components.Tank tank2;
Components.Tank tank1;
Components.LiquidSource source;
equation
connect(source.qOut, tank1.qIn);
connect(piControl1.u, tank1.u);
connect(tank1.y, piControl1.y);
connect(tank1.qOut, tank2.qIn);
connect(piControl2.u, tank2.u);
connect(tank2.y, piControl2.y);
connect(tank2.qOut, tank3.qIn);
connect(piControl3.u, tank3.u);
connect(tank3.y, piControl3.y);
end TankSystem;
6 Hierarchical Component Models
Fig. 6.35 Single tank model icon with PID controller
Fig. 6.36 Current liquid level in the tank (yellow graph) compared to the set (blue) is shown in the
upper graph, with changing flows at the inlet (red graph) and at the outlet (green) are shown in the
lower graph
Components.PIController piControl3(ref = 0.2;
Components.Tank tank3;
Components.Tank tank2;
Components.Tank tank1;
Components.LiquidSource source;
equation
connect(source.qOut, tank1.qIn);
connect(piControl1.u, tank1.u);
connect(tank1.y, piControl1.y);
connect(tank1.qOut, tank2.qIn);
connect(piControl2.u, tank2.u);
connect(tank2.y, piControl2.y);
connect(tank2.qOut, tank3.qIn);
connect(piControl3.u, tank3.u);
connect(tank3.y, piControl3.y);
end TankSystem;