

176
5 Modeling of Mechanical Oscillatory Systems …
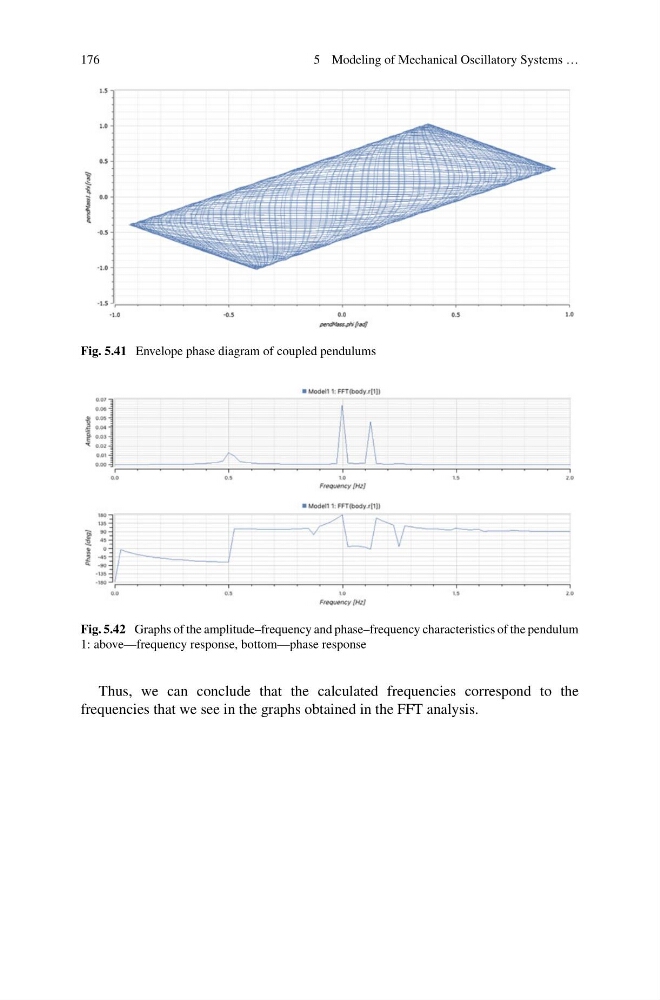
Fig. 5.41 Envelope phase diagram of coupled pendulums
Fig. 5.42 Graphs of the amplitude–frequency and phase–frequency characteristics of the pendulum
1: above—frequency response, bottom—phase response
Thus, we can conclude that the calculated frequencies correspond to the
frequencies that we see in the graphs obtained in the FFT analysis.
5 Modeling of Mechanical Oscillatory Systems …
Fig. 5.41 Envelope phase diagram of coupled pendulums
Fig. 5.42 Graphs of the amplitude–frequency and phase–frequency characteristics of the pendulum
1: above—frequency response, bottom—phase response
Thus, we can conclude that the calculated frequencies correspond to the
frequencies that we see in the graphs obtained in the FFT analysis.