

5.4 Connected Pendulums
175
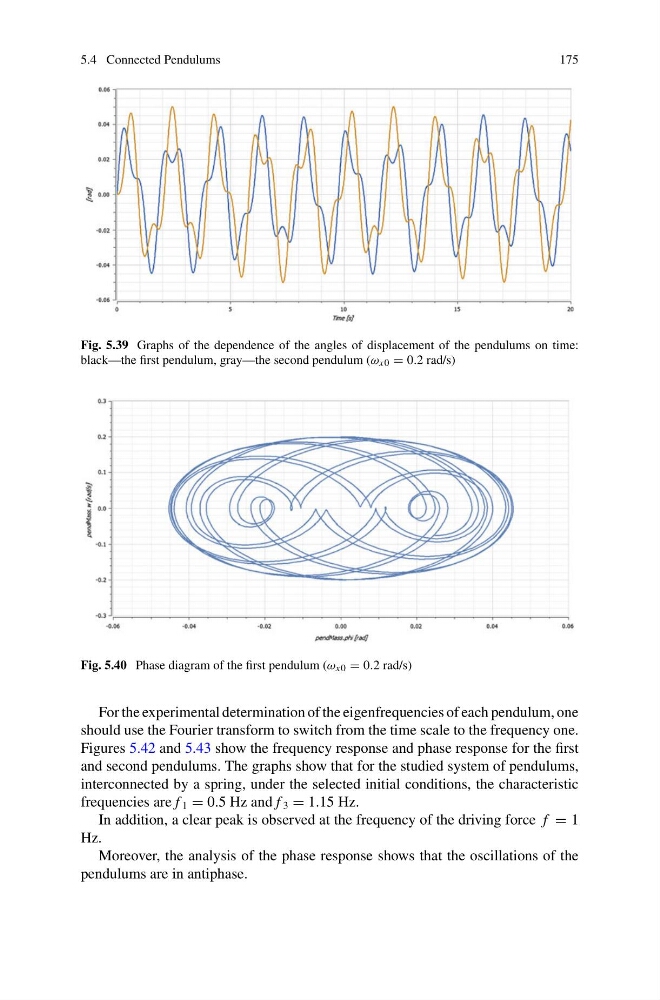
Fig. 5.39 Graphs of the dependence of the angles of displacement of the pendulums on time:
black—the first pendulum, gray—the second pendulum (ω x0 = 0.2 rad/s)
Fig. 5.40 Phase diagram of the first pendulum (ω x0 = 0.2 rad/s)
For the experimental determination of the eigenfrequencies of each pendulum, one
should use the Fourier transform to switch from the time scale to the frequency one.
Figures 5.42 and 5.43 show the frequency response and phase response for the first
and second pendulums. The graphs show that for the studied system of pendulums,
interconnected by a spring, under the selected initial conditions, the characteristic
frequencies are f 1 = 0.5 Hz and f 3 = 1.15 Hz.
In addition, a clear peak is observed at the frequency of the driving force f = 1
Hz.
Moreover, the analysis of the phase response shows that the oscillations of the
pendulums are in antiphase.
175
Fig. 5.39 Graphs of the dependence of the angles of displacement of the pendulums on time:
black—the first pendulum, gray—the second pendulum (ω x0 = 0.2 rad/s)
Fig. 5.40 Phase diagram of the first pendulum (ω x0 = 0.2 rad/s)
For the experimental determination of the eigenfrequencies of each pendulum, one
should use the Fourier transform to switch from the time scale to the frequency one.
Figures 5.42 and 5.43 show the frequency response and phase response for the first
and second pendulums. The graphs show that for the studied system of pendulums,
interconnected by a spring, under the selected initial conditions, the characteristic
frequencies are f 1 = 0.5 Hz and f 3 = 1.15 Hz.
In addition, a clear peak is observed at the frequency of the driving force f = 1
Hz.
Moreover, the analysis of the phase response shows that the oscillations of the
pendulums are in antiphase.