

periphery is the spot expected to be (the default value of
20% was appropriate for our samples).
– Confidence decision: represents the level at which the plugin defines the trajectory as trustworthy (default value:
10 was suitable for our samples).
9. Once settings have been set select “Track” (see Note 12).
10. When the trajectory is obtained and considered robust, export
the result (SpotTracker: Result ! Show as Table ! Summary).
11. A table with the spot coordinates (x,y) for each time point will
appear. Save the table by clicking on File/Save.
12. Label the data in a fully comprehensive manner and store them
in a text file (.csv)
3.4 Data Analysis
To obtain quantitative information regarding the locus trajectory
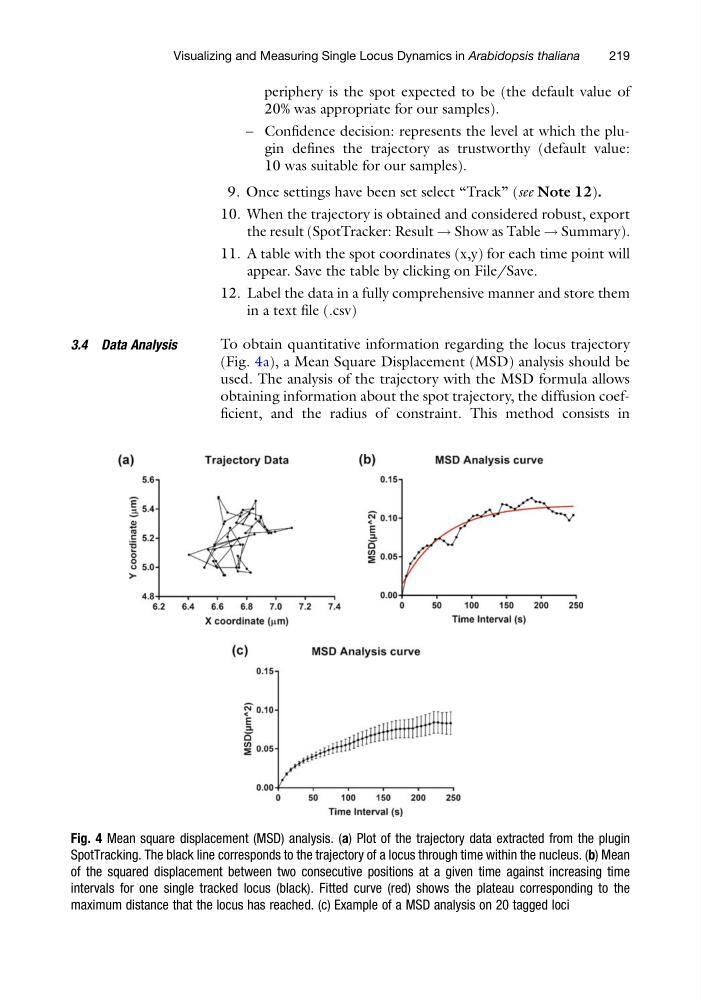
(Fig. 4a), a Mean Square Displacement (MSD) analysis should be
used. The analysis of the trajectory with the MSD formula allows
obtaining information about the spot trajectory, the diffusion coefficient, and the radius of constraint. This method consists in
Fig. 4 Mean square displacement (MSD) analysis. (a) Plot of the trajectory data extracted from the plugin
SpotTracking. The black line corresponds to the trajectory of a locus through time within the nucleus. (b) Mean
of the squared displacement between two consecutive positions at a given time against increasing time
intervals for one single tracked locus (black). Fitted curve (red) shows the plateau corresponding to the
maximum distance that the locus has reached. (c) Example of a MSD analysis on 20 tagged loci
Visualizing and Measuring Single Locus Dynamics in Arabidopsis thaliana
219
20% was appropriate for our samples).
– Confidence decision: represents the level at which the plugin defines the trajectory as trustworthy (default value:
10 was suitable for our samples).
9. Once settings have been set select “Track” (see Note 12).
10. When the trajectory is obtained and considered robust, export
the result (SpotTracker: Result ! Show as Table ! Summary).
11. A table with the spot coordinates (x,y) for each time point will
appear. Save the table by clicking on File/Save.
12. Label the data in a fully comprehensive manner and store them
in a text file (.csv)
3.4 Data Analysis
To obtain quantitative information regarding the locus trajectory
(Fig. 4a), a Mean Square Displacement (MSD) analysis should be
used. The analysis of the trajectory with the MSD formula allows
obtaining information about the spot trajectory, the diffusion coefficient, and the radius of constraint. This method consists in
Fig. 4 Mean square displacement (MSD) analysis. (a) Plot of the trajectory data extracted from the plugin
SpotTracking. The black line corresponds to the trajectory of a locus through time within the nucleus. (b) Mean
of the squared displacement between two consecutive positions at a given time against increasing time
intervals for one single tracked locus (black). Fitted curve (red) shows the plateau corresponding to the
maximum distance that the locus has reached. (c) Example of a MSD analysis on 20 tagged loci
Visualizing and Measuring Single Locus Dynamics in Arabidopsis thaliana
219