

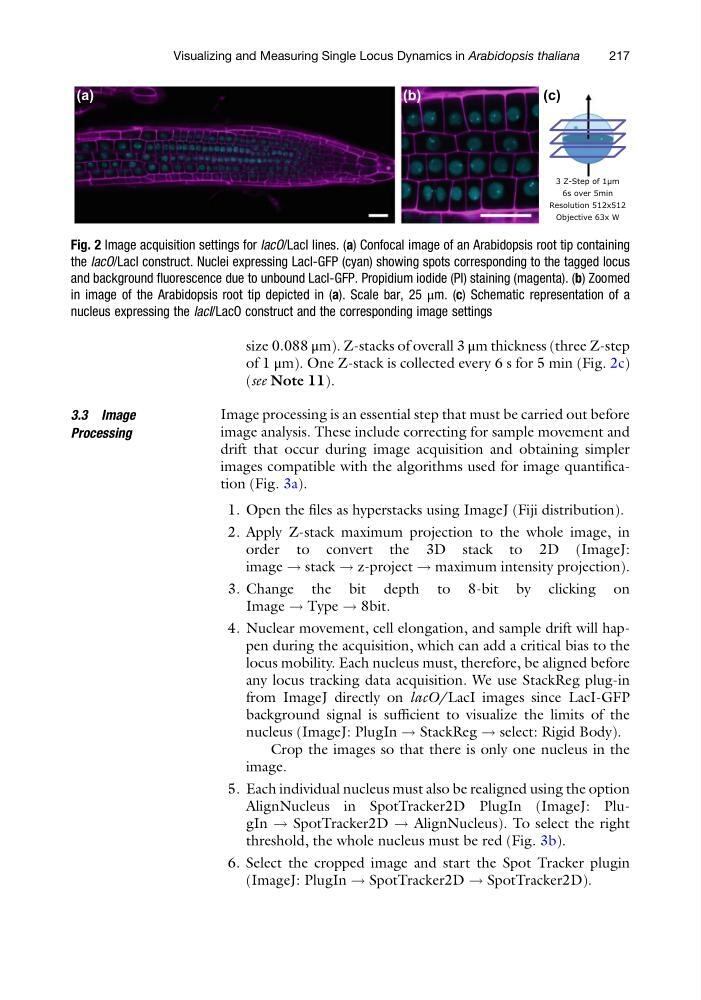
size 0.088 μm). Z-stacks of overall 3 μm thickness (three Z-step
of 1 μm). One Z-stack is collected every 6 s for 5 min (Fig. 2c)
(see Note 11).
3.3 Image
Processing
Image processing is an essential step that must be carried out before
image analysis. These include correcting for sample movement and
drift that occur during image acquisition and obtaining simpler
images compatible with the algorithms used for image quantification (Fig. 3a).
1. Open the files as hyperstacks using ImageJ (Fiji distribution).
2. Apply Z-stack maximum projection to the whole image, in
order to convert the 3D stack to 2D (ImageJ:
image ! stack ! z-project ! maximum intensity projection).
3. Change the bit depth to 8-bit by clicking on
Image ! Type ! 8bit.
4. Nuclear movement, cell elongation, and sample drift will happen during the acquisition, which can add a critical bias to the
locus mobility. Each nucleus must, therefore, be aligned before
any locus tracking data acquisition. We use StackReg plug-in
from ImageJ directly on lacO/LacI images since LacI-GFP
background signal is sufficient to visualize the limits of the
nucleus (ImageJ: PlugIn ! StackReg ! select: Rigid Body).
Crop the images so that there is only one nucleus in the
image.
5. Each individual nucleus must also be realigned using the option
AlignNucleus in SpotTracker2D PlugIn (ImageJ: PlugIn ! SpotTracker2D ! AlignNucleus). To select the right
threshold, the whole nucleus must be red (Fig. 3b).
6. Select the cropped image and start the Spot Tracker plugin
(ImageJ: PlugIn ! SpotTracker2D ! SpotTracker2D).
3 Z-Step of 1µm
6s over 5min
Resolution 512x512
Objective 63x W
(a)
(b)
(c)
Fig. 2 Image acquisition settings for lacO/LacI lines. (a) Confocal image of an Arabidopsis root tip containing
the lacO/LacI construct. Nuclei expressing LacI-GFP (cyan) showing spots corresponding to the tagged locus
and background fluorescence due to unbound LacI-GFP. Propidium iodide (PI) staining (magenta). (b) Zoomed
in image of the Arabidopsis root tip depicted in (a). Scale bar, 25 μm. (c) Schematic representation of a
nucleus expressing the lacI/LacO construct and the corresponding image settings
Visualizing and Measuring Single Locus Dynamics in Arabidopsis thaliana
217
of 1 μm). One Z-stack is collected every 6 s for 5 min (Fig. 2c)
(see Note 11).
3.3 Image
Processing
Image processing is an essential step that must be carried out before
image analysis. These include correcting for sample movement and
drift that occur during image acquisition and obtaining simpler
images compatible with the algorithms used for image quantification (Fig. 3a).
1. Open the files as hyperstacks using ImageJ (Fiji distribution).
2. Apply Z-stack maximum projection to the whole image, in
order to convert the 3D stack to 2D (ImageJ:
image ! stack ! z-project ! maximum intensity projection).
3. Change the bit depth to 8-bit by clicking on
Image ! Type ! 8bit.
4. Nuclear movement, cell elongation, and sample drift will happen during the acquisition, which can add a critical bias to the
locus mobility. Each nucleus must, therefore, be aligned before
any locus tracking data acquisition. We use StackReg plug-in
from ImageJ directly on lacO/LacI images since LacI-GFP
background signal is sufficient to visualize the limits of the
nucleus (ImageJ: PlugIn ! StackReg ! select: Rigid Body).
Crop the images so that there is only one nucleus in the
image.
5. Each individual nucleus must also be realigned using the option
AlignNucleus in SpotTracker2D PlugIn (ImageJ: PlugIn ! SpotTracker2D ! AlignNucleus). To select the right
threshold, the whole nucleus must be red (Fig. 3b).
6. Select the cropped image and start the Spot Tracker plugin
(ImageJ: PlugIn ! SpotTracker2D ! SpotTracker2D).
3 Z-Step of 1µm
6s over 5min
Resolution 512x512
Objective 63x W
(a)
(b)
(c)
Fig. 2 Image acquisition settings for lacO/LacI lines. (a) Confocal image of an Arabidopsis root tip containing
the lacO/LacI construct. Nuclei expressing LacI-GFP (cyan) showing spots corresponding to the tagged locus
and background fluorescence due to unbound LacI-GFP. Propidium iodide (PI) staining (magenta). (b) Zoomed
in image of the Arabidopsis root tip depicted in (a). Scale bar, 25 μm. (c) Schematic representation of a
nucleus expressing the lacI/LacO construct and the corresponding image settings
Visualizing and Measuring Single Locus Dynamics in Arabidopsis thaliana
217