

10 Challenges in Certifying Small-Scale (IoT) Hardware Random Number Generators
175
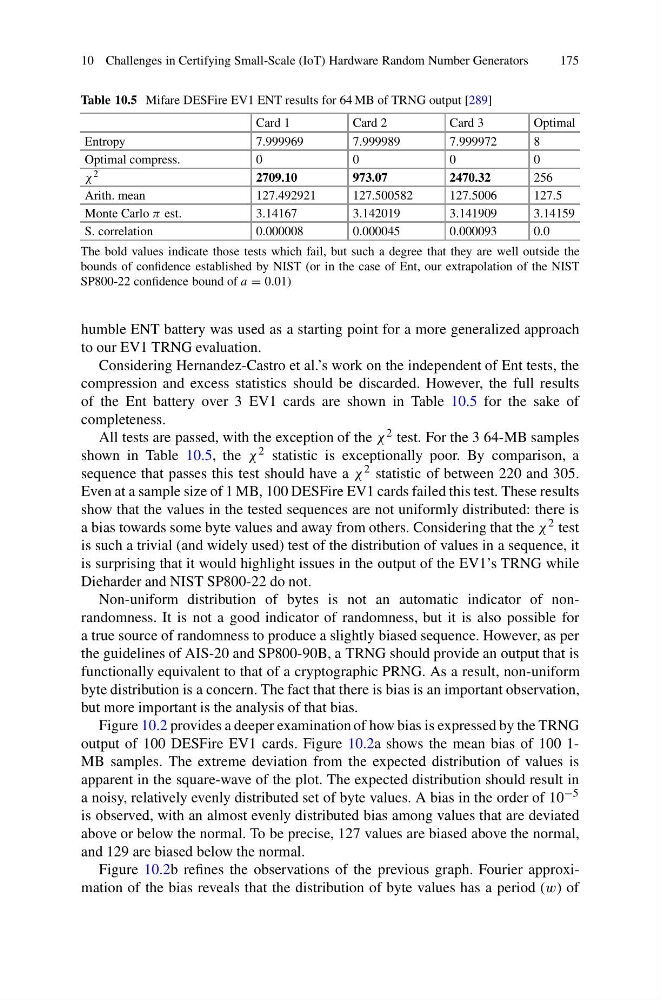
Table 10.5 Mifare DESFire EV1 ENT results for 64 MB of TRNG output [289]
Card 1
Card 2
Card 3
Optimal
Entropy
7.999969
7.999989
7.999972
8
Optimal compress.
0
0
0
0
χ 2
2709.10
973.07
2470.32
256
Arith. mean
127.492921
127.500582
127.5006
127.5
Monte Carlo π est.
3.14167
3.142019
3.141909
3.14159
S. correlation
0.000008
0.000045
0.000093
0.0
The bold values indicate those tests which fail, but such a degree that they are well outside the
bounds of confidence established by NIST (or in the case of Ent, our extrapolation of the NIST
SP800-22 confidence bound of a = 0.01)
humble ENT battery was used as a starting point for a more generalized approach
to our EV1 TRNG evaluation.
Considering Hernandez-Castro et al.’s work on the independent of Ent tests, the
compression and excess statistics should be discarded. However, the full results
of the Ent battery over 3 EV1 cards are shown in Table 10.5 for the sake of
completeness.
All tests are passed, with the exception of the χ 2 test. For the 3 64-MB samples
shown in Table 10.5, the χ 2 statistic is exceptionally poor. By comparison, a
sequence that passes this test should have a χ 2 statistic of between 220 and 305.
Even at a sample size of 1 MB, 100 DESFire EV1 cards failed this test. These results
show that the values in the tested sequences are not uniformly distributed: there is
a bias towards some byte values and away from others. Considering that the χ 2 test
is such a trivial (and widely used) test of the distribution of values in a sequence, it
is surprising that it would highlight issues in the output of the EV1’s TRNG while
Dieharder and NIST SP800-22 do not.
Non-uniform distribution of bytes is not an automatic indicator of nonrandomness. It is not a good indicator of randomness, but it is also possible for
a true source of randomness to produce a slightly biased sequence. However, as per
the guidelines of AIS-20 and SP800-90B, a TRNG should provide an output that is
functionally equivalent to that of a cryptographic PRNG. As a result, non-uniform
byte distribution is a concern. The fact that there is bias is an important observation,
but more important is the analysis of that bias.
Figure 10.2 provides a deeper examination of how bias is expressed by the TRNG
output of 100 DESFire EV1 cards. Figure 10.2a shows the mean bias of 100 1MB samples. The extreme deviation from the expected distribution of values is
apparent in the square-wave of the plot. The expected distribution should result in
a noisy, relatively evenly distributed set of byte values. A bias in the order of 10 −5
is observed, with an almost evenly distributed bias among values that are deviated
above or below the normal. To be precise, 127 values are biased above the normal,
and 129 are biased below the normal.
Figure 10.2b refines the observations of the previous graph. Fourier approximation of the bias reveals that the distribution of byte values has a period (w) of
175
Table 10.5 Mifare DESFire EV1 ENT results for 64 MB of TRNG output [289]
Card 1
Card 2
Card 3
Optimal
Entropy
7.999969
7.999989
7.999972
8
Optimal compress.
0
0
0
0
χ 2
2709.10
973.07
2470.32
256
Arith. mean
127.492921
127.500582
127.5006
127.5
Monte Carlo π est.
3.14167
3.142019
3.141909
3.14159
S. correlation
0.000008
0.000045
0.000093
0.0
The bold values indicate those tests which fail, but such a degree that they are well outside the
bounds of confidence established by NIST (or in the case of Ent, our extrapolation of the NIST
SP800-22 confidence bound of a = 0.01)
humble ENT battery was used as a starting point for a more generalized approach
to our EV1 TRNG evaluation.
Considering Hernandez-Castro et al.’s work on the independent of Ent tests, the
compression and excess statistics should be discarded. However, the full results
of the Ent battery over 3 EV1 cards are shown in Table 10.5 for the sake of
completeness.
All tests are passed, with the exception of the χ 2 test. For the 3 64-MB samples
shown in Table 10.5, the χ 2 statistic is exceptionally poor. By comparison, a
sequence that passes this test should have a χ 2 statistic of between 220 and 305.
Even at a sample size of 1 MB, 100 DESFire EV1 cards failed this test. These results
show that the values in the tested sequences are not uniformly distributed: there is
a bias towards some byte values and away from others. Considering that the χ 2 test
is such a trivial (and widely used) test of the distribution of values in a sequence, it
is surprising that it would highlight issues in the output of the EV1’s TRNG while
Dieharder and NIST SP800-22 do not.
Non-uniform distribution of bytes is not an automatic indicator of nonrandomness. It is not a good indicator of randomness, but it is also possible for
a true source of randomness to produce a slightly biased sequence. However, as per
the guidelines of AIS-20 and SP800-90B, a TRNG should provide an output that is
functionally equivalent to that of a cryptographic PRNG. As a result, non-uniform
byte distribution is a concern. The fact that there is bias is an important observation,
but more important is the analysis of that bias.
Figure 10.2 provides a deeper examination of how bias is expressed by the TRNG
output of 100 DESFire EV1 cards. Figure 10.2a shows the mean bias of 100 1MB samples. The extreme deviation from the expected distribution of values is
apparent in the square-wave of the plot. The expected distribution should result in
a noisy, relatively evenly distributed set of byte values. A bias in the order of 10 −5
is observed, with an almost evenly distributed bias among values that are deviated
above or below the normal. To be precise, 127 values are biased above the normal,
and 129 are biased below the normal.
Figure 10.2b refines the observations of the previous graph. Fourier approximation of the bias reveals that the distribution of byte values has a period (w) of