

176
D. Hurley-Smith and J. Hernandez-Castro
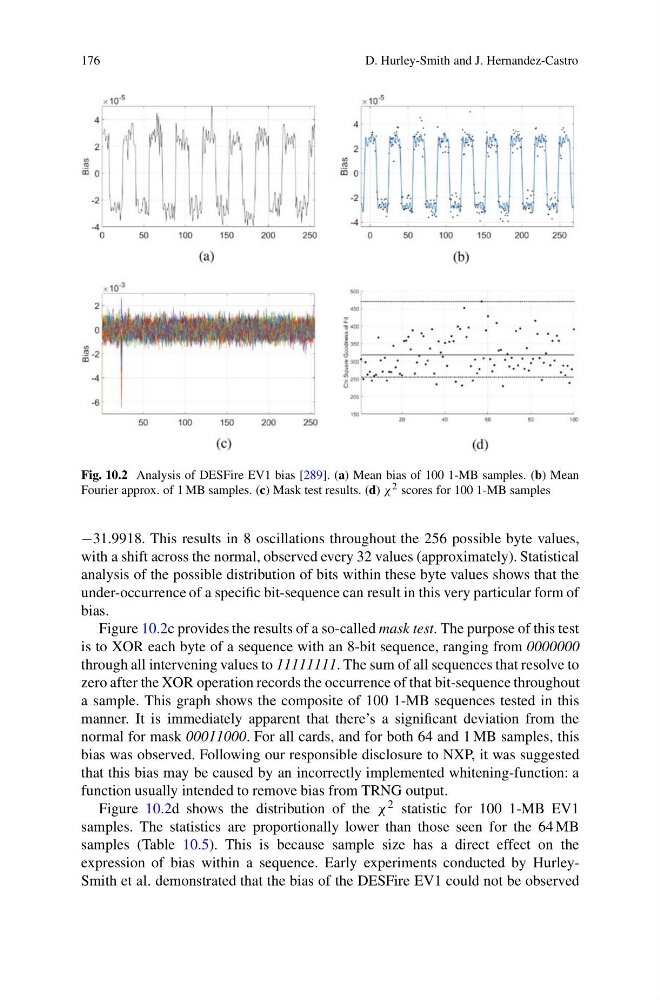
Fig. 10.2 Analysis of DESFire EV1 bias [289]. (a) Mean bias of 100 1-MB samples. (b) Mean
Fourier approx. of 1 MB samples. (c) Mask test results. (d) χ 2 scores for 100 1-MB samples
−31.9918. This results in 8 oscillations throughout the 256 possible byte values,
with a shift across the normal, observed every 32 values (approximately). Statistical
analysis of the possible distribution of bits within these byte values shows that the
under-occurrence of a specific bit-sequence can result in this very particular form of
bias.
Figure 10.2c provides the results of a so-called mask test. The purpose of this test
is to XOR each byte of a sequence with an 8-bit sequence, ranging from 0000000
through all intervening values to 11111111. The sum of all sequences that resolve to
zero after the XOR operation records the occurrence of that bit-sequence throughout
a sample. This graph shows the composite of 100 1-MB sequences tested in this
manner. It is immediately apparent that there’s a significant deviation from the
normal for mask 00011000. For all cards, and for both 64 and 1 MB samples, this
bias was observed. Following our responsible disclosure to NXP, it was suggested
that this bias may be caused by an incorrectly implemented whitening-function: a
function usually intended to remove bias from TRNG output.
Figure 10.2d shows the distribution of the χ 2 statistic for 100 1-MB EV1
samples. The statistics are proportionally lower than those seen for the 64 MB
samples (Table 10.5). This is because sample size has a direct effect on the
expression of bias within a sequence. Early experiments conducted by HurleySmith et al. demonstrated that the bias of the DESFire EV1 could not be observed
D. Hurley-Smith and J. Hernandez-Castro
Fig. 10.2 Analysis of DESFire EV1 bias [289]. (a) Mean bias of 100 1-MB samples. (b) Mean
Fourier approx. of 1 MB samples. (c) Mask test results. (d) χ 2 scores for 100 1-MB samples
−31.9918. This results in 8 oscillations throughout the 256 possible byte values,
with a shift across the normal, observed every 32 values (approximately). Statistical
analysis of the possible distribution of bits within these byte values shows that the
under-occurrence of a specific bit-sequence can result in this very particular form of
bias.
Figure 10.2c provides the results of a so-called mask test. The purpose of this test
is to XOR each byte of a sequence with an 8-bit sequence, ranging from 0000000
through all intervening values to 11111111. The sum of all sequences that resolve to
zero after the XOR operation records the occurrence of that bit-sequence throughout
a sample. This graph shows the composite of 100 1-MB sequences tested in this
manner. It is immediately apparent that there’s a significant deviation from the
normal for mask 00011000. For all cards, and for both 64 and 1 MB samples, this
bias was observed. Following our responsible disclosure to NXP, it was suggested
that this bias may be caused by an incorrectly implemented whitening-function: a
function usually intended to remove bias from TRNG output.
Figure 10.2d shows the distribution of the χ 2 statistic for 100 1-MB EV1
samples. The statistics are proportionally lower than those seen for the 64 MB
samples (Table 10.5). This is because sample size has a direct effect on the
expression of bias within a sequence. Early experiments conducted by HurleySmith et al. demonstrated that the bias of the DESFire EV1 could not be observed