

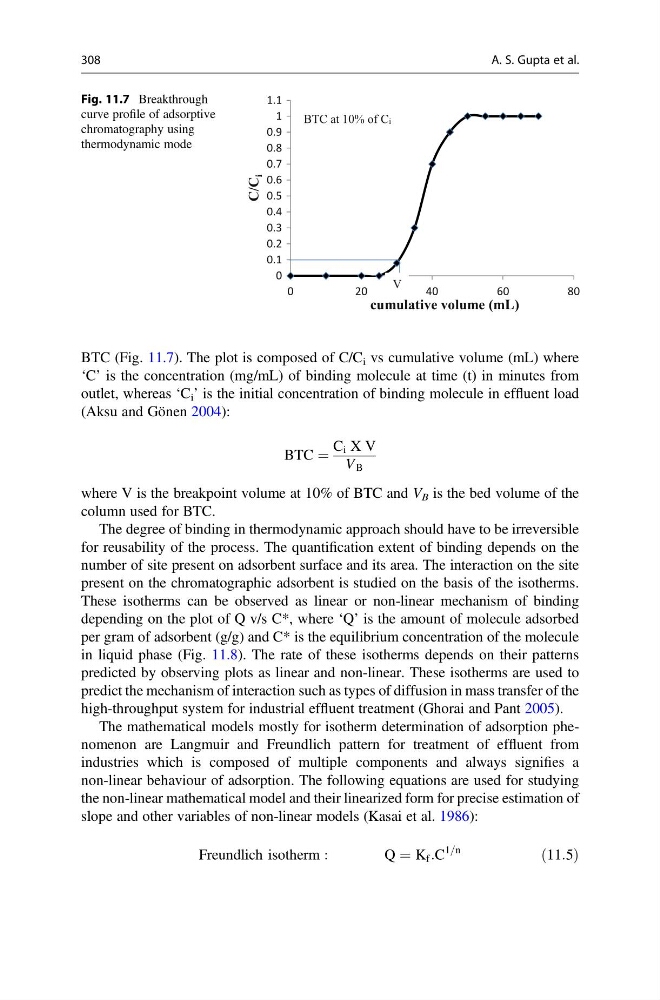
BTC (Fig. 11.7). The plot is composed of C/C i vs cumulative volume (mL) where
‘C’ is the concentration (mg/mL) of binding molecule at time (t) in minutes from
outlet, whereas ‘C i ’ is the initial concentration of binding molecule in effluent load
(Aksu and Gönen 2004):
BTC ¼
C i X V
V B
where V is the breakpoint volume at 10% of BTC and V B is the bed volume of the
column used for BTC.
The degree of binding in thermodynamic approach should have to be irreversible
for reusability of the process. The quantification extent of binding depends on the
number of site present on adsorbent surface and its area. The interaction on the site
present on the chromatographic adsorbent is studied on the basis of the isotherms.
These isotherms can be observed as linear or non-linear mechanism of binding
depending on the plot of Q v/s C*, where ‘Q’ is the amount of molecule adsorbed
per gram of adsorbent (g/g) and C* is the equilibrium concentration of the molecule
in liquid phase (Fig. 11.8). The rate of these isotherms depends on their patterns
predicted by observing plots as linear and non-linear. These isotherms are used to
predict the mechanism of interaction such as types of diffusion in mass transfer of the
high-throughput system for industrial effluent treatment (Ghorai and Pant 2005).
The mathematical models mostly for isotherm determination of adsorption phenomenon are Langmuir and Freundlich pattern for treatment of effluent from
industries which is composed of multiple components and always signifies a
non-linear behaviour of adsorption. The following equations are used for studying
the non-linear mathematical model and their linearized form for precise estimation of
slope and other variables of non-linear models (Kasai et al. 1986):
Freundlich isotherm :
Q ¼ K f :C
1=n
ð11:5Þ
0
0.1
0.2
0.3
0.4
0.5
0.6
0.7
0.8
0.9
1
1.1
0
2 0
4 0
6 0
8 0
C/C
i
cumulative volume (mL)
V
BTC at 10% of Ci
Fig. 11.7 Breakthrough
curve profile of adsorptive
chromatography using
thermodynamic mode
308
A. S. Gupta et al.
‘C’ is the concentration (mg/mL) of binding molecule at time (t) in minutes from
outlet, whereas ‘C i ’ is the initial concentration of binding molecule in effluent load
(Aksu and Gönen 2004):
BTC ¼
C i X V
V B
where V is the breakpoint volume at 10% of BTC and V B is the bed volume of the
column used for BTC.
The degree of binding in thermodynamic approach should have to be irreversible
for reusability of the process. The quantification extent of binding depends on the
number of site present on adsorbent surface and its area. The interaction on the site
present on the chromatographic adsorbent is studied on the basis of the isotherms.
These isotherms can be observed as linear or non-linear mechanism of binding
depending on the plot of Q v/s C*, where ‘Q’ is the amount of molecule adsorbed
per gram of adsorbent (g/g) and C* is the equilibrium concentration of the molecule
in liquid phase (Fig. 11.8). The rate of these isotherms depends on their patterns
predicted by observing plots as linear and non-linear. These isotherms are used to
predict the mechanism of interaction such as types of diffusion in mass transfer of the
high-throughput system for industrial effluent treatment (Ghorai and Pant 2005).
The mathematical models mostly for isotherm determination of adsorption phenomenon are Langmuir and Freundlich pattern for treatment of effluent from
industries which is composed of multiple components and always signifies a
non-linear behaviour of adsorption. The following equations are used for studying
the non-linear mathematical model and their linearized form for precise estimation of
slope and other variables of non-linear models (Kasai et al. 1986):
Freundlich isotherm :
Q ¼ K f :C
1=n
ð11:5Þ
0
0.1
0.2
0.3
0.4
0.5
0.6
0.7
0.8
0.9
1
1.1
0
2 0
4 0
6 0
8 0
C/C
i
cumulative volume (mL)
V
BTC at 10% of Ci
Fig. 11.7 Breakthrough
curve profile of adsorptive
chromatography using
thermodynamic mode
308
A. S. Gupta et al.