

investigated. Oilsorption capacities (g/g) were measured at 25
C in oil–water bath
(formed by 150 ml water and 20 g oil) with 0.1 g of as-prepared sorbent.
The composite polystyrene–polyurethane fiber possesses the porous structure
range 20–80 nm. This three-dimensional structure showed good hydrophobicity–
oleophilicity properties with high oilsorption capacity. The applied voltages affect
the structure and stretch of as-prepared sorbent. It was noticeable that the
polystyrene–polyurethane fibers, which formed at higher voltage, possess a high
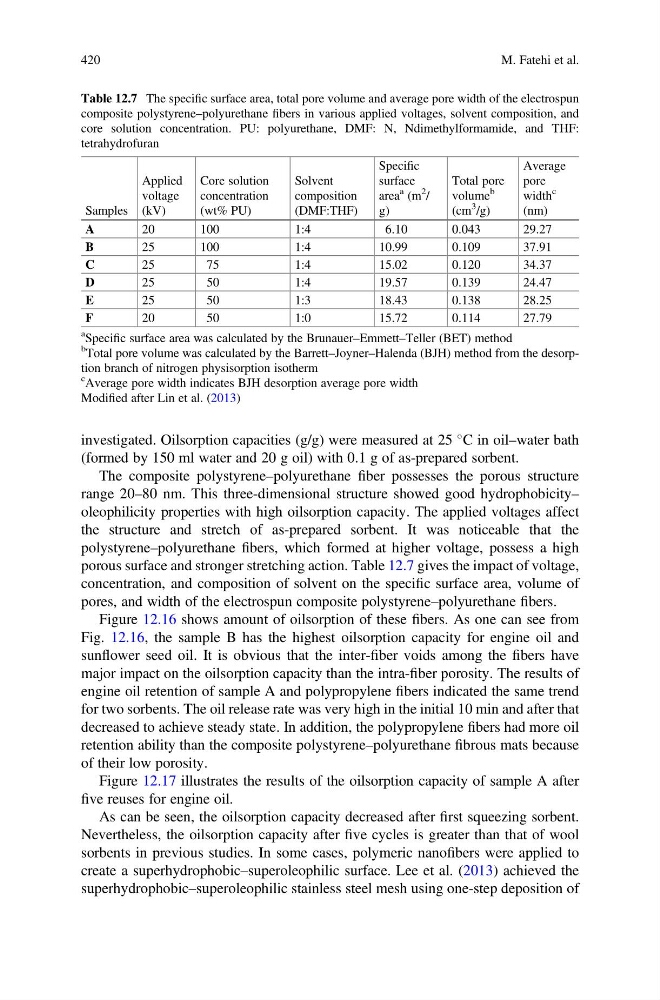
porous surface and stronger stretching action. Table 12.7 gives the impact of voltage,
concentration, and composition of solvent on the specific surface area, volume of
pores, and width of the electrospun composite polystyrene–polyurethane fibers.
Figure 12.16 shows amount of oilsorption of these fibers. As one can see from
Fig. 12.16, the sample B has the highest oilsorption capacity for engine oil and
sunflower seed oil. It is obvious that the inter-fiber voids among the fibers have
major impact on the oilsorption capacity than the intra-fiber porosity. The results of
engine oil retention of sample A and polypropylene fibers indicated the same trend
for two sorbents. The oil release rate was very high in the initial 10 min and after that
decreased to achieve steady state. In addition, the polypropylene fibers had more oil
retention ability than the composite polystyrene–polyurethane fibrous mats because
of their low porosity.
Figure 12.17 illustrates the results of the oilsorption capacity of sample A after
five reuses for engine oil.
As can be seen, the oilsorption capacity decreased after first squeezing sorbent.
Nevertheless, the oilsorption capacity after five cycles is greater than that of wool
sorbents in previous studies. In some cases, polymeric nanofibers were applied to
create a superhydrophobic–superoleophilic surface. Lee et al. (2013) achieved the
superhydrophobic–superoleophilic stainless steel mesh using one-step deposition of
Table 12.7 The specific surface area, total pore volume and average pore width of the electrospun
composite polystyrene–polyurethane fibers in various applied voltages, solvent composition, and
core solution concentration. PU: polyurethane, DMF: N, Ndimethylformamide, and THF:
tetrahydrofuran
Samples
Applied
voltage
(kV)
Core solution
concentration
(wt% PU)
Solvent
composition
(DMF:THF)
Specific
surface
area
a (m
2
/
g)
Total pore
volume
b
(cm
3
/g)
Average
pore
width
c
(nm)
A
20
100
1:4
6.10
0.043
29.27
B
25
100
1:4
10.99
0.109
37.91
C
25
75
1:4
15.02
0.120
34.37
D
25
50
1:4
19.57
0.139
24.47
E
25
50
1:3
18.43
0.138
28.25
F
20
50
1:0
15.72
0.114
27.79
a Specific surface area was calculated by the Brunauer–Emmett–Teller (BET) method
b
Total pore volume was calculated by the Barrett–Joyner–Halenda (BJH) method from the desorption branch of nitrogen physisorption isotherm
c Average pore width indicates BJH desorption average pore width
Modified after Lin et al. (2013)
420
M. Fatehi et al.
C in oil–water bath
(formed by 150 ml water and 20 g oil) with 0.1 g of as-prepared sorbent.
The composite polystyrene–polyurethane fiber possesses the porous structure
range 20–80 nm. This three-dimensional structure showed good hydrophobicity–
oleophilicity properties with high oilsorption capacity. The applied voltages affect
the structure and stretch of as-prepared sorbent. It was noticeable that the
polystyrene–polyurethane fibers, which formed at higher voltage, possess a high
porous surface and stronger stretching action. Table 12.7 gives the impact of voltage,
concentration, and composition of solvent on the specific surface area, volume of
pores, and width of the electrospun composite polystyrene–polyurethane fibers.
Figure 12.16 shows amount of oilsorption of these fibers. As one can see from
Fig. 12.16, the sample B has the highest oilsorption capacity for engine oil and
sunflower seed oil. It is obvious that the inter-fiber voids among the fibers have
major impact on the oilsorption capacity than the intra-fiber porosity. The results of
engine oil retention of sample A and polypropylene fibers indicated the same trend
for two sorbents. The oil release rate was very high in the initial 10 min and after that
decreased to achieve steady state. In addition, the polypropylene fibers had more oil
retention ability than the composite polystyrene–polyurethane fibrous mats because
of their low porosity.
Figure 12.17 illustrates the results of the oilsorption capacity of sample A after
five reuses for engine oil.
As can be seen, the oilsorption capacity decreased after first squeezing sorbent.
Nevertheless, the oilsorption capacity after five cycles is greater than that of wool
sorbents in previous studies. In some cases, polymeric nanofibers were applied to
create a superhydrophobic–superoleophilic surface. Lee et al. (2013) achieved the
superhydrophobic–superoleophilic stainless steel mesh using one-step deposition of
Table 12.7 The specific surface area, total pore volume and average pore width of the electrospun
composite polystyrene–polyurethane fibers in various applied voltages, solvent composition, and
core solution concentration. PU: polyurethane, DMF: N, Ndimethylformamide, and THF:
tetrahydrofuran
Samples
Applied
voltage
(kV)
Core solution
concentration
(wt% PU)
Solvent
composition
(DMF:THF)
Specific
surface
area
a (m
2
/
g)
Total pore
volume
b
(cm
3
/g)
Average
pore
width
c
(nm)
A
20
100
1:4
6.10
0.043
29.27
B
25
100
1:4
10.99
0.109
37.91
C
25
75
1:4
15.02
0.120
34.37
D
25
50
1:4
19.57
0.139
24.47
E
25
50
1:3
18.43
0.138
28.25
F
20
50
1:0
15.72
0.114
27.79
a Specific surface area was calculated by the Brunauer–Emmett–Teller (BET) method
b
Total pore volume was calculated by the Barrett–Joyner–Halenda (BJH) method from the desorption branch of nitrogen physisorption isotherm
c Average pore width indicates BJH desorption average pore width
Modified after Lin et al. (2013)
420
M. Fatehi et al.