

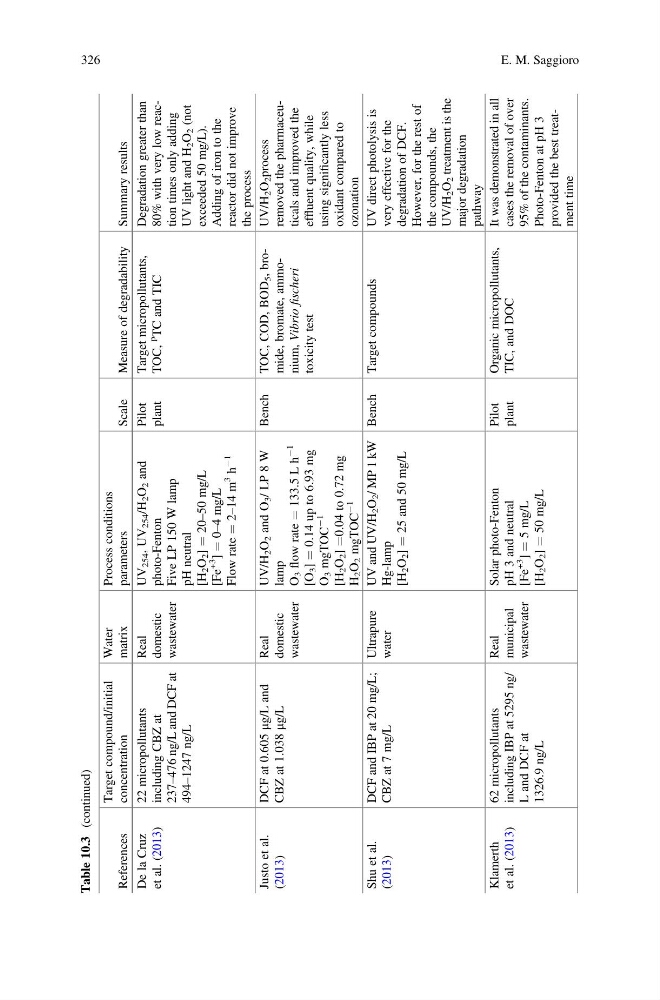
Table 10.3
(continued)
References
Target compound/initial
concentration
Water
matrix
Process conditions
parameters
Scale
Measure of degradability
Summary results
De la Cruz
et al. (2013)
22 micropollutants
including CBZ at
237–476 ng/L and DCF at
494–1247 ng/L
Real
domestic
wastewater
UV
254 , UV
254 /H
2 O
2 and
photo-Fenton
Five LP 150 W lamp
pH neutral
[H
2 O
2 ]
¼ 20–50 mg/L
[Fe
+3
]
¼ 0–4 mg/L
Flow rate
¼ 2–14 m
3
h
À1
Pilot
plant
Target micropollutants,
TOC,
p
TC and TIC
Degradation greater than
80% with very low reaction times only adding
UV light and H
2 O
2 (not
exceeded 50 mg/L).
Adding of iron to the
reactor did not improve
the process
Justo et al.
(2013)
DCF at 0.605
μg/L and
CBZ at 1.038
μg/L
Real
domestic
wastewater
UV/H
2 O
2 and O
3 / LP 8 W
lamp
O
3
flow rate
¼ 133.5 L h
À1
[O
3 ]
¼ 0.14 up to 6.93 mg
O
3 mgTOC
À1
[H
2 O
2 ]
¼0.04 to 0.72 mg
H
2 O
2 mgTOC
À1
Bench
TOC, COD, BOD
5 , bromide, bromate, ammonium, Vibrio
fischeri
toxicity test
UV/H
2 O
2 process
removed the pharmaceuticals and improved the
effluent quality, while
using significantly less
oxidant compared to
ozonation
Shu et al.
(2013)
DCF and IBP at 20 mg/L;
CBZ at 7 mg/L
Ultrapure
water
UV and UV/H
2 O
2 / MP 1 kW
Hg-lamp
[H
2 O
2 ]
¼ 25 and 50 mg/L
Bench
Target compounds
UV direct photolysis is
very effective for the
degradation of DCF.
However, for the rest of
the compounds, the
UV/H
2 O
2 treatment is the
major degradation
pathway
Klamerth
et al. (2013)
62 micropollutants
including IBP at 5295 ng/
L and DCF at
1326.9 ng/L
Real
municipal
wastewater
Solar photo-Fenton
pH 3 and neutral
[Fe
+3
]
¼ 5 mg/L
[H
2 O
2 ]
¼ 50 mg/L
Pilot
plant
Organic micropollutants,
TIC, and DOC
It was demonstrated in all
cases the removal of over
95% of the contaminants.
Photo-Fenton at pH 3
provided the best treatment time
326
E. M. Saggioro
(continued)
References
Target compound/initial
concentration
Water
matrix
Process conditions
parameters
Scale
Measure of degradability
Summary results
De la Cruz
et al. (2013)
22 micropollutants
including CBZ at
237–476 ng/L and DCF at
494–1247 ng/L
Real
domestic
wastewater
UV
254 , UV
254 /H
2 O
2 and
photo-Fenton
Five LP 150 W lamp
pH neutral
[H
2 O
2 ]
¼ 20–50 mg/L
[Fe
+3
]
¼ 0–4 mg/L
Flow rate
¼ 2–14 m
3
h
À1
Pilot
plant
Target micropollutants,
TOC,
p
TC and TIC
Degradation greater than
80% with very low reaction times only adding
UV light and H
2 O
2 (not
exceeded 50 mg/L).
Adding of iron to the
reactor did not improve
the process
Justo et al.
(2013)
DCF at 0.605
μg/L and
CBZ at 1.038
μg/L
Real
domestic
wastewater
UV/H
2 O
2 and O
3 / LP 8 W
lamp
O
3
flow rate
¼ 133.5 L h
À1
[O
3 ]
¼ 0.14 up to 6.93 mg
O
3 mgTOC
À1
[H
2 O
2 ]
¼0.04 to 0.72 mg
H
2 O
2 mgTOC
À1
Bench
TOC, COD, BOD
5 , bromide, bromate, ammonium, Vibrio
fischeri
toxicity test
UV/H
2 O
2 process
removed the pharmaceuticals and improved the
effluent quality, while
using significantly less
oxidant compared to
ozonation
Shu et al.
(2013)
DCF and IBP at 20 mg/L;
CBZ at 7 mg/L
Ultrapure
water
UV and UV/H
2 O
2 / MP 1 kW
Hg-lamp
[H
2 O
2 ]
¼ 25 and 50 mg/L
Bench
Target compounds
UV direct photolysis is
very effective for the
degradation of DCF.
However, for the rest of
the compounds, the
UV/H
2 O
2 treatment is the
major degradation
pathway
Klamerth
et al. (2013)
62 micropollutants
including IBP at 5295 ng/
L and DCF at
1326.9 ng/L
Real
municipal
wastewater
Solar photo-Fenton
pH 3 and neutral
[Fe
+3
]
¼ 5 mg/L
[H
2 O
2 ]
¼ 50 mg/L
Pilot
plant
Organic micropollutants,
TIC, and DOC
It was demonstrated in all
cases the removal of over
95% of the contaminants.
Photo-Fenton at pH 3
provided the best treatment time
326
E. M. Saggioro