

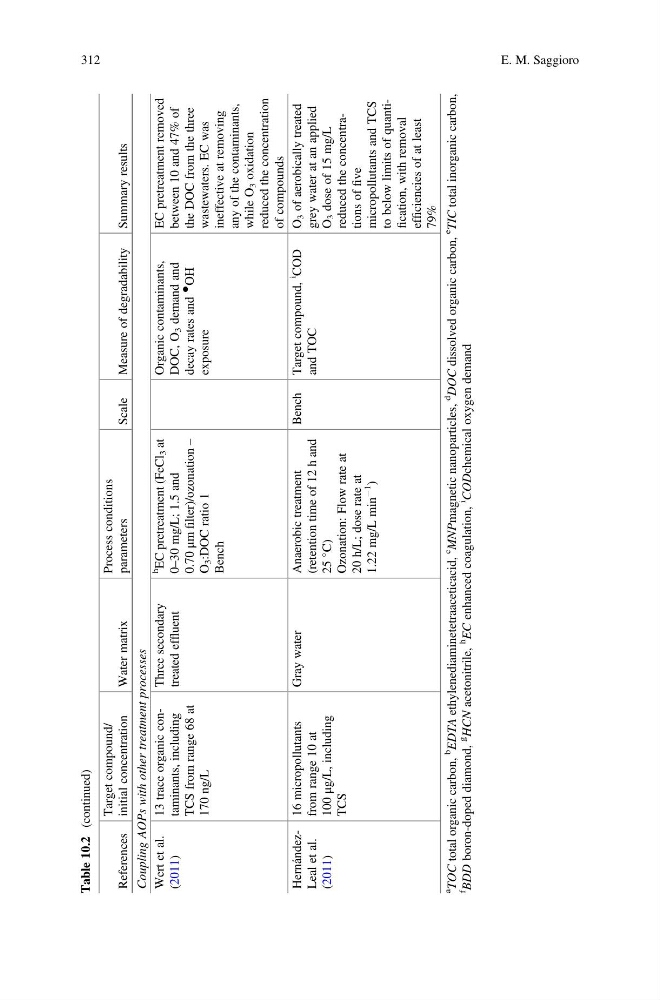
Table 10.2
(continued)
References
Target compound/
initial concentration
Water matrix
Process conditions
parameters
Scale
Measure of degradability
Summary results
Coupling AOPs with other treatment processes
Wert et al.
(2011)
13 trace organic contaminants, including
TCS from range 68 at
170 ng/L
Three secondary
treated effluent
h
EC pretreatment (FeCl
3 at
0–30 mg/L; 1.5 and
0.70
μm filter)/ozonation –
O
3 :DOC ratio 1
Bench
Organic contaminants,
DOC, O
3 demand and
decay rates and
●
OH
exposure
EC pretreatment removed
between 10 and 47% of
the DOC from the three
wastewaters. EC was
ineffective at removing
any of the contaminants,
while O
3 oxidation
reduced the concentration
of compounds
HernándezLeal et al.
(2011)
16 micropollutants
from range 10 at
100
μg/L, including
TCS
Gray water
Anaerobic treatment
(retention time of 12 h and
25
C)
Ozonation: Flow rate at
20 h/L; dose rate at
1.22 mg/L min
À1
)
Bench Target compound,
i
COD
and TOC
O
3 of aerobically treated
grey water at an applied
O
3 dose of 15 mg/L
reduced the concentrations of
five
micropollutants and TCS
to below limits of quantification, with removal
efficiencies of at least
79%
a
TOC
total organic carbon,
b
EDTA
ethylenediaminetetraaceticacid,
c
MNPmagnetic
nanoparticles,
d
DOC
dissolved organic carbon,
e
TIC
total inorganic carbon,
f
BDD
boron-doped diamond,
g
HCN
acetonitrile,
h
EC
enhanced coagulation,
i
CODchemical
oxygen demand
312
E. M. Saggioro
(continued)
References
Target compound/
initial concentration
Water matrix
Process conditions
parameters
Scale
Measure of degradability
Summary results
Coupling AOPs with other treatment processes
Wert et al.
(2011)
13 trace organic contaminants, including
TCS from range 68 at
170 ng/L
Three secondary
treated effluent
h
EC pretreatment (FeCl
3 at
0–30 mg/L; 1.5 and
0.70
μm filter)/ozonation –
O
3 :DOC ratio 1
Bench
Organic contaminants,
DOC, O
3 demand and
decay rates and
●
OH
exposure
EC pretreatment removed
between 10 and 47% of
the DOC from the three
wastewaters. EC was
ineffective at removing
any of the contaminants,
while O
3 oxidation
reduced the concentration
of compounds
HernándezLeal et al.
(2011)
16 micropollutants
from range 10 at
100
μg/L, including
TCS
Gray water
Anaerobic treatment
(retention time of 12 h and
25
C)
Ozonation: Flow rate at
20 h/L; dose rate at
1.22 mg/L min
À1
)
Bench Target compound,
i
COD
and TOC
O
3 of aerobically treated
grey water at an applied
O
3 dose of 15 mg/L
reduced the concentrations of
five
micropollutants and TCS
to below limits of quantification, with removal
efficiencies of at least
79%
a
TOC
total organic carbon,
b
EDTA
ethylenediaminetetraaceticacid,
c
MNPmagnetic
nanoparticles,
d
DOC
dissolved organic carbon,
e
TIC
total inorganic carbon,
f
BDD
boron-doped diamond,
g
HCN
acetonitrile,
h
EC
enhanced coagulation,
i
CODchemical
oxygen demand
312
E. M. Saggioro