

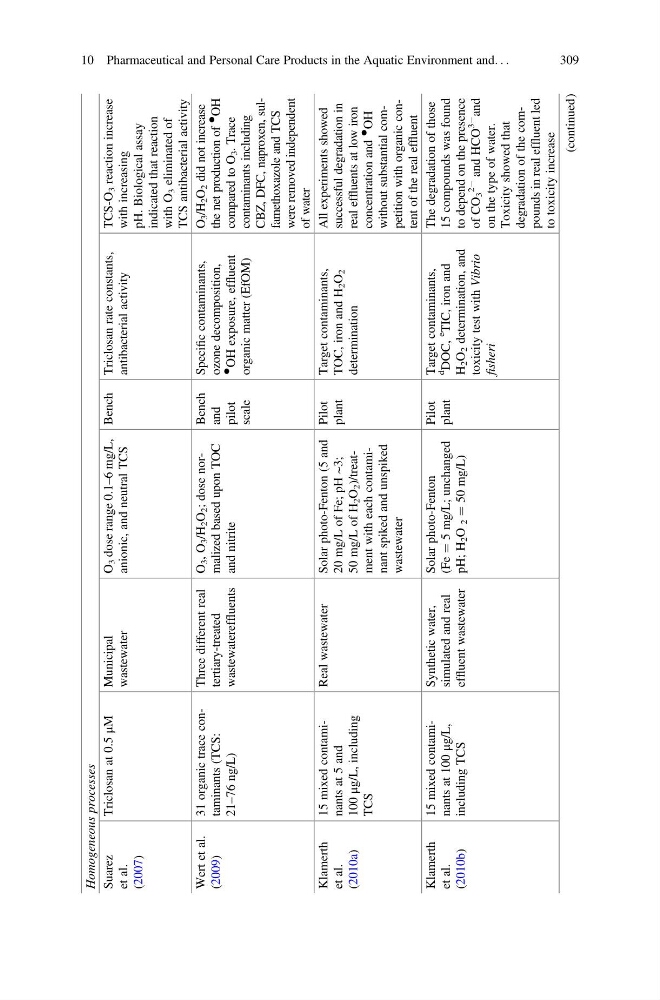
Homogeneous processes
Suarez
et al.
(2007)
Triclosan at 0.5
μM
Municipal
wastewater
O
3 dose range 0.1–6 mg/L,
anionic, and neutral TCS
Bench Triclosan rate constants,
antibacterial activity
TCS-O
3 reaction increase
with increasing
pH. Biological assay
indicated that reaction
with O
3 eliminated of
TCS antibacterial activity
Wert et al.
(2009)
31 organic trace contaminants (TCS:
21–76 ng/L)
Three different real
tertiary-treated
wastewatereffluents
O
3 , O
3 /H
2 O
2 ; dose normalized based upon TOC
and nitrite
Bench
and
pilot
scale
Specific contaminants,
ozone decomposition,
●
OH exposure, effluent
organic matter (EfOM)
O
3 /H
2 O
2 did not increase
the net production of
●
OH
compared to O
3 . Trace
contaminants including
CBZ, DFC, naproxen, sulfamethoxazole and TCS
were removed independent
of water
Klamerth
et al.
(2010a)
15 mixed contaminants at 5 and
100
μg/L, including
TCS
Real wastewater
Solar photo-Fenton (5 and
20 mg/L of Fe; pH ~3;
50 mg/L of H
2 O
2 )/treatment with each contaminant spiked and unspiked
wastewater
Pilot
plant
Target contaminants,
TOC, iron and H
2 O
2
determination
All experiments showed
successful degradation in
real effluents at low iron
concentration and
●
OH
without substantial competition with organic content of the real effluent
Klamerth
et al.
(2010b)
15 mixed contaminants at 100
μg/L,
including TCS
Synthetic water,
simulated and real
effluent wastewater
Solar photo-Fenton
(Fe
¼ 5 mg/L; unchanged
pH; H
2 O
2
¼ 50 mg/L)
Pilot
plant
Target contaminants,
d
DOC,
e
TIC, iron and
H
2 O
2 determination, and
toxicity test with Vibrio
fisheri
The degradation of those
15 compounds was found
to depend on the presence
of CO
3
2À
and HCO
3À
and
on the type of water.
Toxicity showed that
degradation of the compounds in real effluent led
to toxicity increase
(continued)
10 Pharmaceutical and Personal Care Products in the Aquatic Environment and. . .
309
Suarez
et al.
(2007)
Triclosan at 0.5
μM
Municipal
wastewater
O
3 dose range 0.1–6 mg/L,
anionic, and neutral TCS
Bench Triclosan rate constants,
antibacterial activity
TCS-O
3 reaction increase
with increasing
pH. Biological assay
indicated that reaction
with O
3 eliminated of
TCS antibacterial activity
Wert et al.
(2009)
31 organic trace contaminants (TCS:
21–76 ng/L)
Three different real
tertiary-treated
wastewatereffluents
O
3 , O
3 /H
2 O
2 ; dose normalized based upon TOC
and nitrite
Bench
and
pilot
scale
Specific contaminants,
ozone decomposition,
●
OH exposure, effluent
organic matter (EfOM)
O
3 /H
2 O
2 did not increase
the net production of
●
OH
compared to O
3 . Trace
contaminants including
CBZ, DFC, naproxen, sulfamethoxazole and TCS
were removed independent
of water
Klamerth
et al.
(2010a)
15 mixed contaminants at 5 and
100
μg/L, including
TCS
Real wastewater
Solar photo-Fenton (5 and
20 mg/L of Fe; pH ~3;
50 mg/L of H
2 O
2 )/treatment with each contaminant spiked and unspiked
wastewater
Pilot
plant
Target contaminants,
TOC, iron and H
2 O
2
determination
All experiments showed
successful degradation in
real effluents at low iron
concentration and
●
OH
without substantial competition with organic content of the real effluent
Klamerth
et al.
(2010b)
15 mixed contaminants at 100
μg/L,
including TCS
Synthetic water,
simulated and real
effluent wastewater
Solar photo-Fenton
(Fe
¼ 5 mg/L; unchanged
pH; H
2 O
2
¼ 50 mg/L)
Pilot
plant
Target contaminants,
d
DOC,
e
TIC, iron and
H
2 O
2 determination, and
toxicity test with Vibrio
fisheri
The degradation of those
15 compounds was found
to depend on the presence
of CO
3
2À
and HCO
3À
and
on the type of water.
Toxicity showed that
degradation of the compounds in real effluent led
to toxicity increase
(continued)
10 Pharmaceutical and Personal Care Products in the Aquatic Environment and. . .
309