

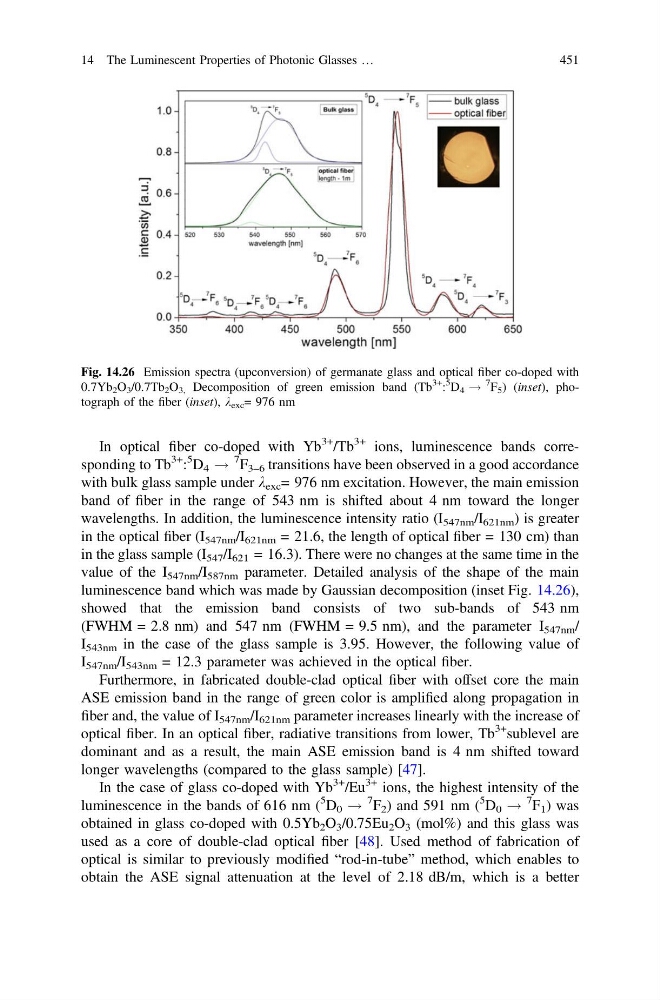
In optical fiber co-doped with Yb
3+ /Tb
3+ ions, luminescence bands corresponding to Tb
3+ :
5 D 4 !
7 F 3–6 transitions have been observed in a good accordance
with bulk glass sample under k exc = 976 nm excitation. However, the main emission
band of fiber in the range of 543 nm is shifted about 4 nm toward the longer
wavelengths. In addition, the luminescence intensity ratio (I 547nm /I 621nm ) is greater
in the optical fiber (I 547nm /I 621nm = 21.6, the length of optical fiber = 130 cm) than
in the glass sample (I 547 /I 621 = 16.3). There were no changes at the same time in the
value of the I 547nm /I 587nm parameter. Detailed analysis of the shape of the main
luminescence band which was made by Gaussian decomposition (inset Fig. 14.26),
showed that the emission band consists of two sub-bands of 543 nm
(FWHM = 2.8 nm) and 547 nm (FWHM = 9.5 nm), and the parameter I 547nm /
I 543nm in the case of the glass sample is 3.95. However, the following value of
I 547nm /I 543nm = 12.3 parameter was achieved in the optical fiber.
Furthermore, in fabricated double-clad optical fiber with offset core the main
ASE emission band in the range of green color is amplified along propagation in
fiber and, the value of I 547nm /I 621nm parameter increases linearly with the increase of
optical fiber. In an optical fiber, radiative transitions from lower, Tb
3+ sublevel are
dominant and as a result, the main ASE emission band is 4 nm shifted toward
longer wavelengths (compared to the glass sample) [47].
In the case of glass co-doped with Yb
3+ /Eu
3+ ions, the highest intensity of the
luminescence in the bands of 616 nm (
5 D 0 !
7 F 2 ) and 591 nm (
5 D 0 !
7 F 1 ) was
obtained in glass co-doped with 0.5Yb 2 O 3 /0.75Eu 2 O 3 (mol%) and this glass was
used as a core of double-clad optical fiber [48]. Used method of fabrication of
optical is similar to previously modified “rod-in-tube” method, which enables to
obtain the ASE signal attenuation at the level of 2.18 dB/m, which is a better
Fig. 14.26 Emission spectra (upconversion) of germanate glass and optical fiber co-doped with
0.7Yb 2 O 3 /0.7Tb 2 O 3, Decomposition of green emission band (Tb
3+ :
5
D 4 !
7
F 5 ) (inset), photograph of the fiber (inset), k exc = 976 nm
14 The Luminescent Properties of Photonic Glasses …
451
3+ /Tb
3+ ions, luminescence bands corresponding to Tb
3+ :
5 D 4 !
7 F 3–6 transitions have been observed in a good accordance
with bulk glass sample under k exc = 976 nm excitation. However, the main emission
band of fiber in the range of 543 nm is shifted about 4 nm toward the longer
wavelengths. In addition, the luminescence intensity ratio (I 547nm /I 621nm ) is greater
in the optical fiber (I 547nm /I 621nm = 21.6, the length of optical fiber = 130 cm) than
in the glass sample (I 547 /I 621 = 16.3). There were no changes at the same time in the
value of the I 547nm /I 587nm parameter. Detailed analysis of the shape of the main
luminescence band which was made by Gaussian decomposition (inset Fig. 14.26),
showed that the emission band consists of two sub-bands of 543 nm
(FWHM = 2.8 nm) and 547 nm (FWHM = 9.5 nm), and the parameter I 547nm /
I 543nm in the case of the glass sample is 3.95. However, the following value of
I 547nm /I 543nm = 12.3 parameter was achieved in the optical fiber.
Furthermore, in fabricated double-clad optical fiber with offset core the main
ASE emission band in the range of green color is amplified along propagation in
fiber and, the value of I 547nm /I 621nm parameter increases linearly with the increase of
optical fiber. In an optical fiber, radiative transitions from lower, Tb
3+ sublevel are
dominant and as a result, the main ASE emission band is 4 nm shifted toward
longer wavelengths (compared to the glass sample) [47].
In the case of glass co-doped with Yb
3+ /Eu
3+ ions, the highest intensity of the
luminescence in the bands of 616 nm (
5 D 0 !
7 F 2 ) and 591 nm (
5 D 0 !
7 F 1 ) was
obtained in glass co-doped with 0.5Yb 2 O 3 /0.75Eu 2 O 3 (mol%) and this glass was
used as a core of double-clad optical fiber [48]. Used method of fabrication of
optical is similar to previously modified “rod-in-tube” method, which enables to
obtain the ASE signal attenuation at the level of 2.18 dB/m, which is a better
Fig. 14.26 Emission spectra (upconversion) of germanate glass and optical fiber co-doped with
0.7Yb 2 O 3 /0.7Tb 2 O 3, Decomposition of green emission band (Tb
3+ :
5
D 4 !
7
F 5 ) (inset), photograph of the fiber (inset), k exc = 976 nm
14 The Luminescent Properties of Photonic Glasses …
451