

values are quite constant with a rise in temperature, although the temperature is
possibly not stable enough for the PDMS waveguides due to environmental
changes and heating from active elements, e.g. the optical laser and electronics.
In order to test the material refractive indices under different heat stresses simulating accelerated ageing, the same conditions as used for optical insertion loss
measurements as discussed later had been applied. The refractive indices measured
at 589 nm changed only within the measurement uncertainties (PDMS RT 601
cladding (mixture 19:1) n = 1.4108 ± 1 and PDMS SLM 77522 (mixture 9:1)
n = 1.4405 ± 2). From those measurements, the stability of the numerical aperture
has been calculated, which is also illustrated in Fig. 13.3c.
In optical waveguides, mode dispersion (different propagation constants for each
mode) and material dispersion are the main effects, which limit the bandwidth of the
optical waveguide transmission. Based on the obtained Sellmeier fitting curves, as
shown in Fig. 13.3a, the material dispersion curves of the PDMS cladding and core
were both obtained using the material dispersion equations below (c/n is the fibre
light velocity):
M k
ð Þ ¼ À
n Á k
c
Á
d
2 n
dk
2
ð13:3Þ
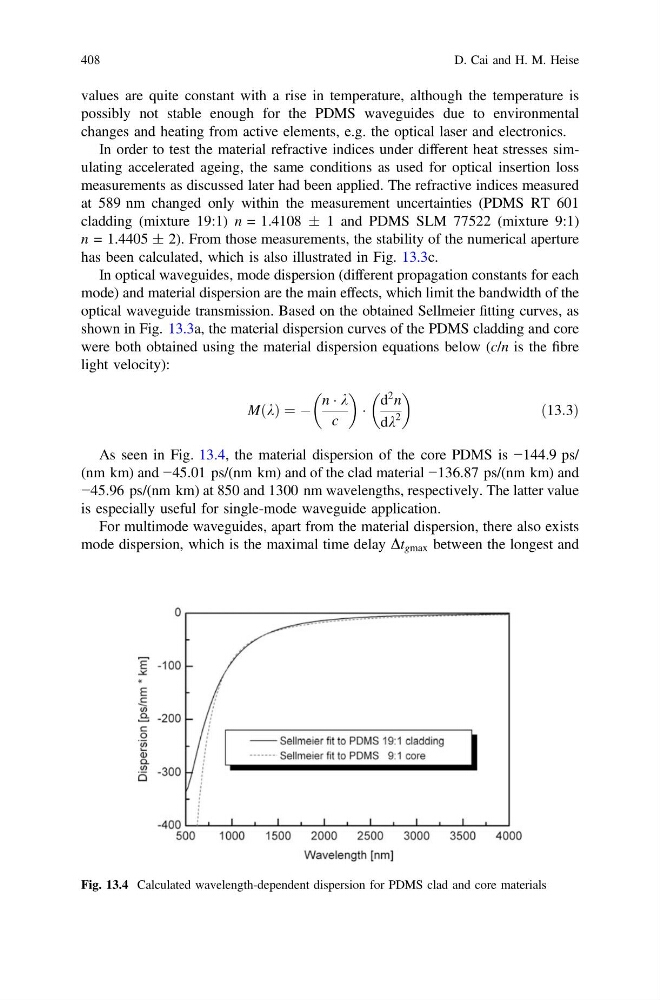
As seen in Fig. 13.4, the material dispersion of the core PDMS is −144.9 ps/
(nm km) and −45.01 ps/(nm km) and of the clad material −136.87 ps/(nm km) and
−45.96 ps/(nm km) at 850 and 1300 nm wavelengths, respectively. The latter value
is especially useful for single-mode waveguide application.
For multimode waveguides, apart from the material dispersion, there also exists
mode dispersion, which is the maximal time delay Dt gmax between the longest and
Fig. 13.4 Calculated wavelength-dependent dispersion for PDMS clad and core materials
408
D. Cai and H. M. Heise
possibly not stable enough for the PDMS waveguides due to environmental
changes and heating from active elements, e.g. the optical laser and electronics.
In order to test the material refractive indices under different heat stresses simulating accelerated ageing, the same conditions as used for optical insertion loss
measurements as discussed later had been applied. The refractive indices measured
at 589 nm changed only within the measurement uncertainties (PDMS RT 601
cladding (mixture 19:1) n = 1.4108 ± 1 and PDMS SLM 77522 (mixture 9:1)
n = 1.4405 ± 2). From those measurements, the stability of the numerical aperture
has been calculated, which is also illustrated in Fig. 13.3c.
In optical waveguides, mode dispersion (different propagation constants for each
mode) and material dispersion are the main effects, which limit the bandwidth of the
optical waveguide transmission. Based on the obtained Sellmeier fitting curves, as
shown in Fig. 13.3a, the material dispersion curves of the PDMS cladding and core
were both obtained using the material dispersion equations below (c/n is the fibre
light velocity):
M k
ð Þ ¼ À
n Á k
c
Á
d
2 n
dk
2
ð13:3Þ
As seen in Fig. 13.4, the material dispersion of the core PDMS is −144.9 ps/
(nm km) and −45.01 ps/(nm km) and of the clad material −136.87 ps/(nm km) and
−45.96 ps/(nm km) at 850 and 1300 nm wavelengths, respectively. The latter value
is especially useful for single-mode waveguide application.
For multimode waveguides, apart from the material dispersion, there also exists
mode dispersion, which is the maximal time delay Dt gmax between the longest and
Fig. 13.4 Calculated wavelength-dependent dispersion for PDMS clad and core materials
408
D. Cai and H. M. Heise