

fitting satisfactorily almost all refractive index data of materials in practical use
within their main transparent region:
n
2
¼ 1 þ
B 1 k
2
k
2
À C 1
þ
B 2 k
2
k
2
À C 2
þ
B 3 k
2
k
2
À C 3
ð13:1Þ
where n is the optical index at wavelength k, and B 1 , B 2 and B 3 and C 1 , C 2 and C 3
are the constants to be determined by the fitting process.
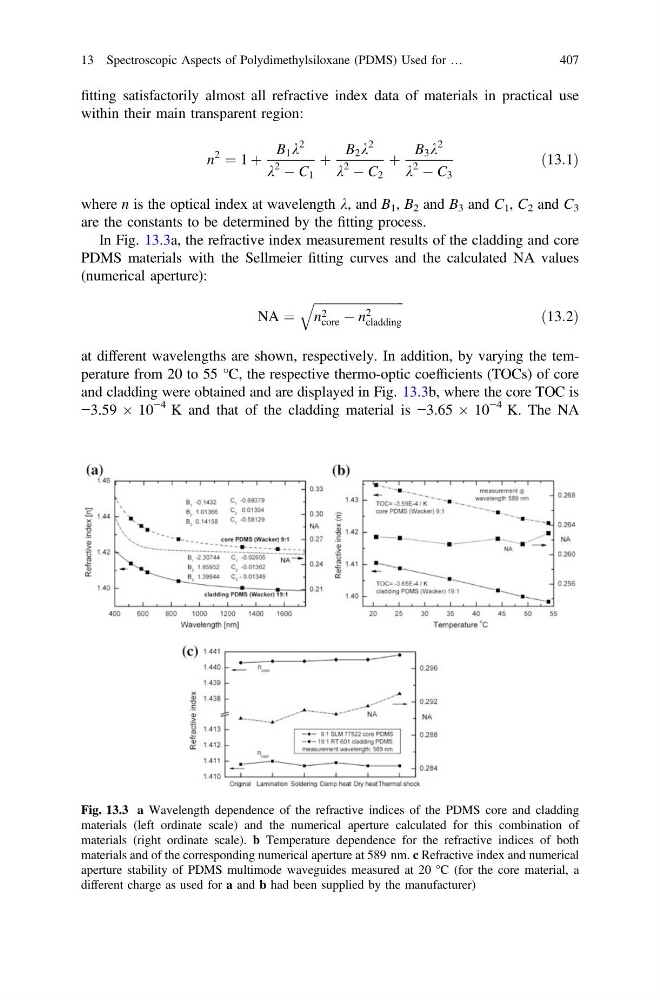
In Fig. 13.3a, the refractive index measurement results of the cladding and core
PDMS materials with the Sellmeier fitting curves and the calculated NA values
(numerical aperture):
NA ¼
ffiffiffiffiffiffiffiffiffiffiffiffiffiffiffiffiffiffiffiffiffiffiffiffiffiffiffiffi ffi
n 2
core À n 2
cladding
q
ð13:2Þ
at different wavelengths are shown, respectively. In addition, by varying the temperature from 20 to 55 °C, the respective thermo-optic coefficients (TOCs) of core
and cladding were obtained and are displayed in Fig. 13.3b, where the core TOC is
−3.59 Â 10
−4 K and that of the cladding material is −3.65 Â 10
−4 K. The NA
Fig. 13.3 a Wavelength dependence of the refractive indices of the PDMS core and cladding
materials (left ordinate scale) and the numerical aperture calculated for this combination of
materials (right ordinate scale). b Temperature dependence for the refractive indices of both
materials and of the corresponding numerical aperture at 589 nm. c Refractive index and numerical
aperture stability of PDMS multimode waveguides measured at 20 °C (for the core material, a
different charge as used for a and b had been supplied by the manufacturer)
13 Spectroscopic Aspects of Polydimethylsiloxane (PDMS) Used for …
407
within their main transparent region:
n
2
¼ 1 þ
B 1 k
2
k
2
À C 1
þ
B 2 k
2
k
2
À C 2
þ
B 3 k
2
k
2
À C 3
ð13:1Þ
where n is the optical index at wavelength k, and B 1 , B 2 and B 3 and C 1 , C 2 and C 3
are the constants to be determined by the fitting process.
In Fig. 13.3a, the refractive index measurement results of the cladding and core
PDMS materials with the Sellmeier fitting curves and the calculated NA values
(numerical aperture):
NA ¼
ffiffiffiffiffiffiffiffiffiffiffiffiffiffiffiffiffiffiffiffiffiffiffiffiffiffiffiffi ffi
n 2
core À n 2
cladding
q
ð13:2Þ
at different wavelengths are shown, respectively. In addition, by varying the temperature from 20 to 55 °C, the respective thermo-optic coefficients (TOCs) of core
and cladding were obtained and are displayed in Fig. 13.3b, where the core TOC is
−3.59 Â 10
−4 K and that of the cladding material is −3.65 Â 10
−4 K. The NA
Fig. 13.3 a Wavelength dependence of the refractive indices of the PDMS core and cladding
materials (left ordinate scale) and the numerical aperture calculated for this combination of
materials (right ordinate scale). b Temperature dependence for the refractive indices of both
materials and of the corresponding numerical aperture at 589 nm. c Refractive index and numerical
aperture stability of PDMS multimode waveguides measured at 20 °C (for the core material, a
different charge as used for a and b had been supplied by the manufacturer)
13 Spectroscopic Aspects of Polydimethylsiloxane (PDMS) Used for …
407