

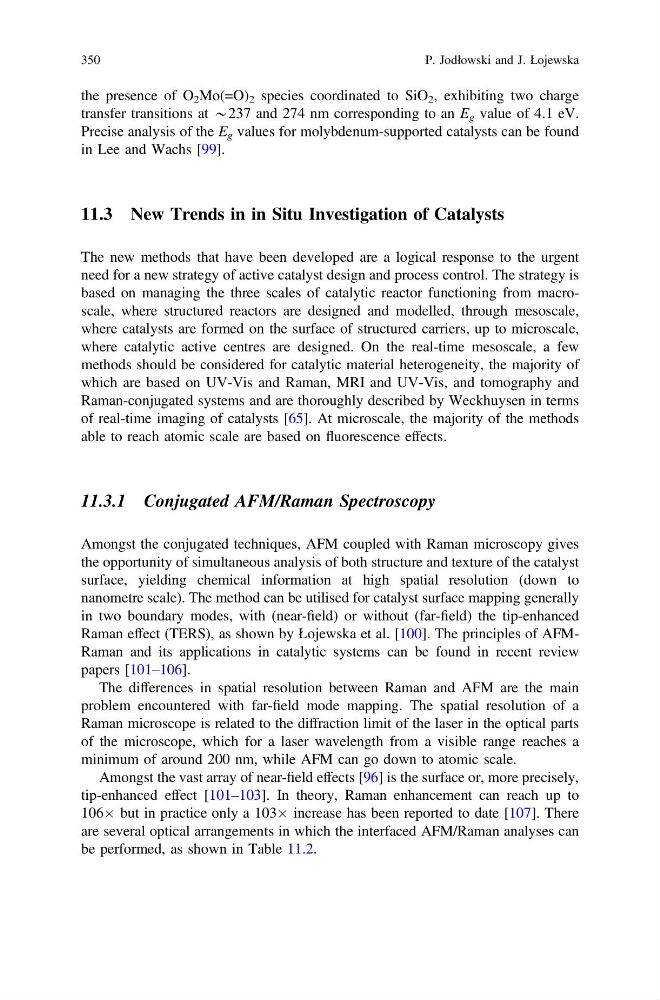
the presence of O 2 Mo(=O) 2 species coordinated to SiO 2 , exhibiting two charge
transfer transitions at *237 and 274 nm corresponding to an E g value of 4.1 eV.
Precise analysis of the E g values for molybdenum-supported catalysts can be found
in Lee and Wachs [99].
11.3 New Trends in in Situ Investigation of Catalysts
The new methods that have been developed are a logical response to the urgent
need for a new strategy of active catalyst design and process control. The strategy is
based on managing the three scales of catalytic reactor functioning from macroscale, where structured reactors are designed and modelled, through mesoscale,
where catalysts are formed on the surface of structured carriers, up to microscale,
where catalytic active centres are designed. On the real-time mesoscale, a few
methods should be considered for catalytic material heterogeneity, the majority of
which are based on UV-Vis and Raman, MRI and UV-Vis, and tomography and
Raman-conjugated systems and are thoroughly described by Weckhuysen in terms
of real-time imaging of catalysts [65]. At microscale, the majority of the methods
able to reach atomic scale are based on fluorescence effects.
11.3.1 Conjugated AFM/Raman Spectroscopy
Amongst the conjugated techniques, AFM coupled with Raman microscopy gives
the opportunity of simultaneous analysis of both structure and texture of the catalyst
surface, yielding chemical information at high spatial resolution (down to
nanometre scale). The method can be utilised for catalyst surface mapping generally
in two boundary modes, with (near-field) or without (far-field) the tip-enhanced
Raman effect (TERS), as shown by Łojewska et al. [100]. The principles of AFMRaman and its applications in catalytic systems can be found in recent review
papers [101–106].
The differences in spatial resolution between Raman and AFM are the main
problem encountered with far-field mode mapping. The spatial resolution of a
Raman microscope is related to the diffraction limit of the laser in the optical parts
of the microscope, which for a laser wavelength from a visible range reaches a
minimum of around 200 nm, while AFM can go down to atomic scale.
Amongst the vast array of near-field effects [96] is the surface or, more precisely,
tip-enhanced effect [101–103]. In theory, Raman enhancement can reach up to
106Â but in practice only a 103Â increase has been reported to date [107]. There
are several optical arrangements in which the interfaced AFM/Raman analyses can
be performed, as shown in Table 11.2.
350
P. Jodłowski and J. Łojewska
transfer transitions at *237 and 274 nm corresponding to an E g value of 4.1 eV.
Precise analysis of the E g values for molybdenum-supported catalysts can be found
in Lee and Wachs [99].
11.3 New Trends in in Situ Investigation of Catalysts
The new methods that have been developed are a logical response to the urgent
need for a new strategy of active catalyst design and process control. The strategy is
based on managing the three scales of catalytic reactor functioning from macroscale, where structured reactors are designed and modelled, through mesoscale,
where catalysts are formed on the surface of structured carriers, up to microscale,
where catalytic active centres are designed. On the real-time mesoscale, a few
methods should be considered for catalytic material heterogeneity, the majority of
which are based on UV-Vis and Raman, MRI and UV-Vis, and tomography and
Raman-conjugated systems and are thoroughly described by Weckhuysen in terms
of real-time imaging of catalysts [65]. At microscale, the majority of the methods
able to reach atomic scale are based on fluorescence effects.
11.3.1 Conjugated AFM/Raman Spectroscopy
Amongst the conjugated techniques, AFM coupled with Raman microscopy gives
the opportunity of simultaneous analysis of both structure and texture of the catalyst
surface, yielding chemical information at high spatial resolution (down to
nanometre scale). The method can be utilised for catalyst surface mapping generally
in two boundary modes, with (near-field) or without (far-field) the tip-enhanced
Raman effect (TERS), as shown by Łojewska et al. [100]. The principles of AFMRaman and its applications in catalytic systems can be found in recent review
papers [101–106].
The differences in spatial resolution between Raman and AFM are the main
problem encountered with far-field mode mapping. The spatial resolution of a
Raman microscope is related to the diffraction limit of the laser in the optical parts
of the microscope, which for a laser wavelength from a visible range reaches a
minimum of around 200 nm, while AFM can go down to atomic scale.
Amongst the vast array of near-field effects [96] is the surface or, more precisely,
tip-enhanced effect [101–103]. In theory, Raman enhancement can reach up to
106Â but in practice only a 103Â increase has been reported to date [107]. There
are several optical arrangements in which the interfaced AFM/Raman analyses can
be performed, as shown in Table 11.2.
350
P. Jodłowski and J. Łojewska