

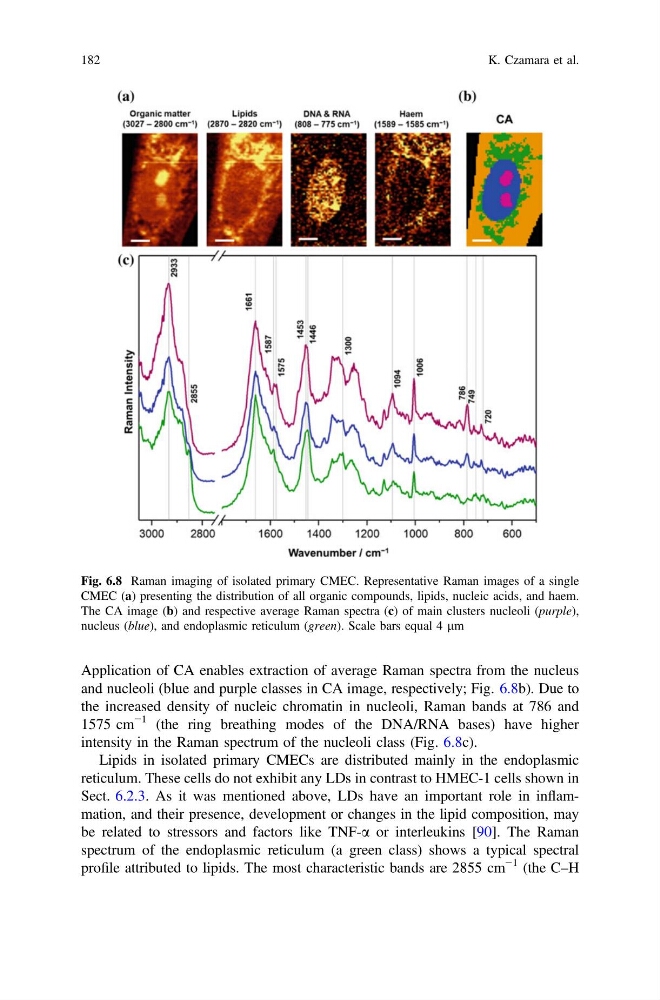
Application of CA enables extraction of average Raman spectra from the nucleus
and nucleoli (blue and purple classes in CA image, respectively; Fig. 6.8b). Due to
the increased density of nucleic chromatin in nucleoli, Raman bands at 786 and
1575 cm
−1 (the ring breathing modes of the DNA/RNA bases) have higher
intensity in the Raman spectrum of the nucleoli class (Fig. 6.8c).
Lipids in isolated primary CMECs are distributed mainly in the endoplasmic
reticulum. These cells do not exhibit any LDs in contrast to HMEC-1 cells shown in
Sect. 6.2.3. As it was mentioned above, LDs have an important role in inflammation, and their presence, development or changes in the lipid composition, may
be related to stressors and factors like TNF-a or interleukins [90]. The Raman
spectrum of the endoplasmic reticulum (a green class) shows a typical spectral
profile attributed to lipids. The most characteristic bands are 2855 cm
−1 (the C–H
Fig. 6.8 Raman imaging of isolated primary CMEC. Representative Raman images of a single
CMEC (a) presenting the distribution of all organic compounds, lipids, nucleic acids, and haem.
The CA image (b) and respective average Raman spectra (c) of main clusters nucleoli (purple),
nucleus (blue), and endoplasmic reticulum (green). Scale bars equal 4 lm
182
K. Czamara et al.
and nucleoli (blue and purple classes in CA image, respectively; Fig. 6.8b). Due to
the increased density of nucleic chromatin in nucleoli, Raman bands at 786 and
1575 cm
−1 (the ring breathing modes of the DNA/RNA bases) have higher
intensity in the Raman spectrum of the nucleoli class (Fig. 6.8c).
Lipids in isolated primary CMECs are distributed mainly in the endoplasmic
reticulum. These cells do not exhibit any LDs in contrast to HMEC-1 cells shown in
Sect. 6.2.3. As it was mentioned above, LDs have an important role in inflammation, and their presence, development or changes in the lipid composition, may
be related to stressors and factors like TNF-a or interleukins [90]. The Raman
spectrum of the endoplasmic reticulum (a green class) shows a typical spectral
profile attributed to lipids. The most characteristic bands are 2855 cm
−1 (the C–H
Fig. 6.8 Raman imaging of isolated primary CMEC. Representative Raman images of a single
CMEC (a) presenting the distribution of all organic compounds, lipids, nucleic acids, and haem.
The CA image (b) and respective average Raman spectra (c) of main clusters nucleoli (purple),
nucleus (blue), and endoplasmic reticulum (green). Scale bars equal 4 lm
182
K. Czamara et al.