

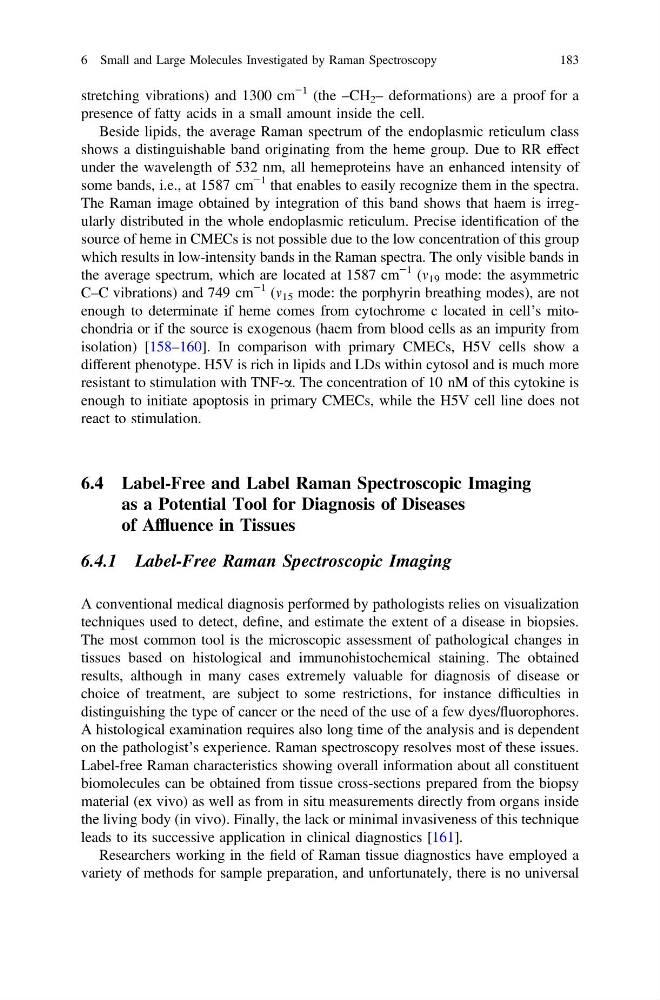
stretching vibrations) and 1300 cm
−1 (the –CH 2 – deformations) are a proof for a
presence of fatty acids in a small amount inside the cell.
Beside lipids, the average Raman spectrum of the endoplasmic reticulum class
shows a distinguishable band originating from the heme group. Due to RR effect
under the wavelength of 532 nm, all hemeproteins have an enhanced intensity of
some bands, i.e., at 1587 cm
−1 that enables to easily recognize them in the spectra.
The Raman image obtained by integration of this band shows that haem is irregularly distributed in the whole endoplasmic reticulum. Precise identification of the
source of heme in CMECs is not possible due to the low concentration of this group
which results in low-intensity bands in the Raman spectra. The only visible bands in
the average spectrum, which are located at 1587 cm
−1 (m 19 mode: the asymmetric
C–C vibrations) and 749 cm
−1 (m 15 mode: the porphyrin breathing modes), are not
enough to determinate if heme comes from cytochrome c located in cell’s mitochondria or if the source is exogenous (haem from blood cells as an impurity from
isolation) [158–160]. In comparison with primary CMECs, H5V cells show a
different phenotype. H5V is rich in lipids and LDs within cytosol and is much more
resistant to stimulation with TNF-a. The concentration of 10 nM of this cytokine is
enough to initiate apoptosis in primary CMECs, while the H5V cell line does not
react to stimulation.
6.4 Label-Free and Label Raman Spectroscopic Imaging
as a Potential Tool for Diagnosis of Diseases
of Affluence in Tissues
6.4.1 Label-Free Raman Spectroscopic Imaging
A conventional medical diagnosis performed by pathologists relies on visualization
techniques used to detect, define, and estimate the extent of a disease in biopsies.
The most common tool is the microscopic assessment of pathological changes in
tissues based on histological and immunohistochemical staining. The obtained
results, although in many cases extremely valuable for diagnosis of disease or
choice of treatment, are subject to some restrictions, for instance difficulties in
distinguishing the type of cancer or the need of the use of a few dyes/fluorophores.
A histological examination requires also long time of the analysis and is dependent
on the pathologist’s experience. Raman spectroscopy resolves most of these issues.
Label-free Raman characteristics showing overall information about all constituent
biomolecules can be obtained from tissue cross-sections prepared from the biopsy
material (ex vivo) as well as from in situ measurements directly from organs inside
the living body (in vivo). Finally, the lack or minimal invasiveness of this technique
leads to its successive application in clinical diagnostics [161].
Researchers working in the field of Raman tissue diagnostics have employed a
variety of methods for sample preparation, and unfortunately, there is no universal
6 Small and Large Molecules Investigated by Raman Spectroscopy
183
−1 (the –CH 2 – deformations) are a proof for a
presence of fatty acids in a small amount inside the cell.
Beside lipids, the average Raman spectrum of the endoplasmic reticulum class
shows a distinguishable band originating from the heme group. Due to RR effect
under the wavelength of 532 nm, all hemeproteins have an enhanced intensity of
some bands, i.e., at 1587 cm
−1 that enables to easily recognize them in the spectra.
The Raman image obtained by integration of this band shows that haem is irregularly distributed in the whole endoplasmic reticulum. Precise identification of the
source of heme in CMECs is not possible due to the low concentration of this group
which results in low-intensity bands in the Raman spectra. The only visible bands in
the average spectrum, which are located at 1587 cm
−1 (m 19 mode: the asymmetric
C–C vibrations) and 749 cm
−1 (m 15 mode: the porphyrin breathing modes), are not
enough to determinate if heme comes from cytochrome c located in cell’s mitochondria or if the source is exogenous (haem from blood cells as an impurity from
isolation) [158–160]. In comparison with primary CMECs, H5V cells show a
different phenotype. H5V is rich in lipids and LDs within cytosol and is much more
resistant to stimulation with TNF-a. The concentration of 10 nM of this cytokine is
enough to initiate apoptosis in primary CMECs, while the H5V cell line does not
react to stimulation.
6.4 Label-Free and Label Raman Spectroscopic Imaging
as a Potential Tool for Diagnosis of Diseases
of Affluence in Tissues
6.4.1 Label-Free Raman Spectroscopic Imaging
A conventional medical diagnosis performed by pathologists relies on visualization
techniques used to detect, define, and estimate the extent of a disease in biopsies.
The most common tool is the microscopic assessment of pathological changes in
tissues based on histological and immunohistochemical staining. The obtained
results, although in many cases extremely valuable for diagnosis of disease or
choice of treatment, are subject to some restrictions, for instance difficulties in
distinguishing the type of cancer or the need of the use of a few dyes/fluorophores.
A histological examination requires also long time of the analysis and is dependent
on the pathologist’s experience. Raman spectroscopy resolves most of these issues.
Label-free Raman characteristics showing overall information about all constituent
biomolecules can be obtained from tissue cross-sections prepared from the biopsy
material (ex vivo) as well as from in situ measurements directly from organs inside
the living body (in vivo). Finally, the lack or minimal invasiveness of this technique
leads to its successive application in clinical diagnostics [161].
Researchers working in the field of Raman tissue diagnostics have employed a
variety of methods for sample preparation, and unfortunately, there is no universal
6 Small and Large Molecules Investigated by Raman Spectroscopy
183