

Changes in this communication may result in cardiac diseases. Complexity and
heterogeneity of the heart require, especially for studies of diseases development,
primary cells whose phenotype is more similar to cells in vivo than cell lines.
CMECs seem to be a satisfying in vitro model for studies on progression of heart
failure what was already confirmed [156]. Moreover, due to the reduction of NO
bioavailability and inflammation, endothelial dysfunction has the biggest impact on
myocardium, thus, endothelial cells’ condition may serve as early diagnostic biomarker and target for novel drug therapies.
Primary isolated CMECs are usually small with slightly elongated shape.
Compared to other cardiac endothelial cells, i.e., to the H5V cell line (a transformed
endothelial cell line from the murine heart), CMECs adhere to substrate in more
irregular shape, as well as they tend to create rather variable structures instead of a
homogeneous layer. Raman imaging unveils additional features within cells [157].
Due to high lateral resolution and confocality, Raman images of CMECs present
the subcellular environment (Fig. 6.8a). All organelles are clearly visible in the
Raman image obtained by integration of bands in the spectral range 3027–2800
cm
−1 showing the distribution of organic compounds. The most distinct structure in
Raman images of CMECs is a relatively large nucleus. The nucleus, the densest
structure inside cell, is visible in Raman images as an ellipsoidal structure with
diameter of 15–20 lm and 2–3 small nucleoli within it. Nucleoli, due to lack of a
surrounding biomembrane, have irregular shape and do not exceed 6 lm.
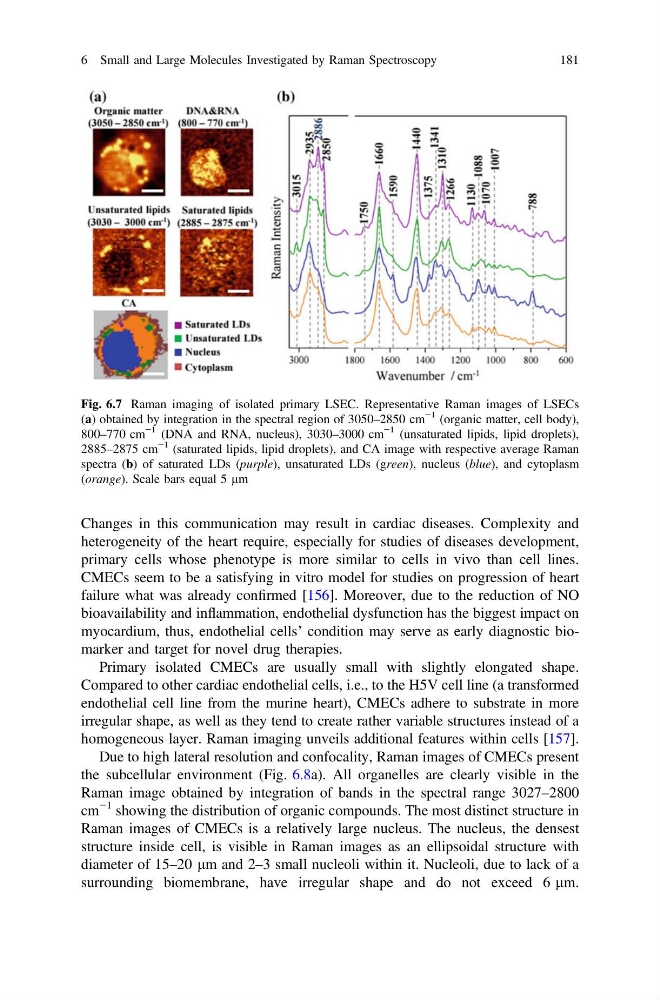
Fig. 6.7 Raman imaging of isolated primary LSEC. Representative Raman images of LSECs
(a) obtained by integration in the spectral region of 3050–2850 cm
−1 (organic matter, cell body),
800–770 cm
−1 (DNA and RNA, nucleus), 3030–3000 cm
−1 (unsaturated lipids, lipid droplets),
2885–2875 cm
−1 (saturated lipids, lipid droplets), and CA image with respective average Raman
spectra (b) of saturated LDs (purple), unsaturated LDs (green), nucleus (blue), and cytoplasm
(orange). Scale bars equal 5 lm
6 Small and Large Molecules Investigated by Raman Spectroscopy
181
heterogeneity of the heart require, especially for studies of diseases development,
primary cells whose phenotype is more similar to cells in vivo than cell lines.
CMECs seem to be a satisfying in vitro model for studies on progression of heart
failure what was already confirmed [156]. Moreover, due to the reduction of NO
bioavailability and inflammation, endothelial dysfunction has the biggest impact on
myocardium, thus, endothelial cells’ condition may serve as early diagnostic biomarker and target for novel drug therapies.
Primary isolated CMECs are usually small with slightly elongated shape.
Compared to other cardiac endothelial cells, i.e., to the H5V cell line (a transformed
endothelial cell line from the murine heart), CMECs adhere to substrate in more
irregular shape, as well as they tend to create rather variable structures instead of a
homogeneous layer. Raman imaging unveils additional features within cells [157].
Due to high lateral resolution and confocality, Raman images of CMECs present
the subcellular environment (Fig. 6.8a). All organelles are clearly visible in the
Raman image obtained by integration of bands in the spectral range 3027–2800
cm
−1 showing the distribution of organic compounds. The most distinct structure in
Raman images of CMECs is a relatively large nucleus. The nucleus, the densest
structure inside cell, is visible in Raman images as an ellipsoidal structure with
diameter of 15–20 lm and 2–3 small nucleoli within it. Nucleoli, due to lack of a
surrounding biomembrane, have irregular shape and do not exceed 6 lm.
Fig. 6.7 Raman imaging of isolated primary LSEC. Representative Raman images of LSECs
(a) obtained by integration in the spectral region of 3050–2850 cm
−1 (organic matter, cell body),
800–770 cm
−1 (DNA and RNA, nucleus), 3030–3000 cm
−1 (unsaturated lipids, lipid droplets),
2885–2875 cm
−1 (saturated lipids, lipid droplets), and CA image with respective average Raman
spectra (b) of saturated LDs (purple), unsaturated LDs (green), nucleus (blue), and cytoplasm
(orange). Scale bars equal 5 lm
6 Small and Large Molecules Investigated by Raman Spectroscopy
181