

The peak at approximately 1585 cm
−1 in the Raman spectra taken from the
MWCNTs is downshifted by 1 cm
−1 compared to the peak position found for the
MWCNTs for 785 nm excitation wavelength; see also Fig. 4.3c for the experimental spectrum and fitted band components. Contrary, the 1585 cm
−1 line position
is upshifted by 2 cm
−1 when the wavelength is changed from 532 to 1064 nm. The
higher wavenumber peak at 1617 cm
−1 for the MWCNTs recorded at 532 nm
shows a downshift of 5 and 8 cm
−1 when the excitation wavelength is changed
from 532 nm to 785 and 1064 nm, respectively. The lower wavenumber peak in the
MWCNT Raman bands recorded at all three excitation wavelengths appeared at
almost the same position in graphite for corresponding excitation wavelengths. The
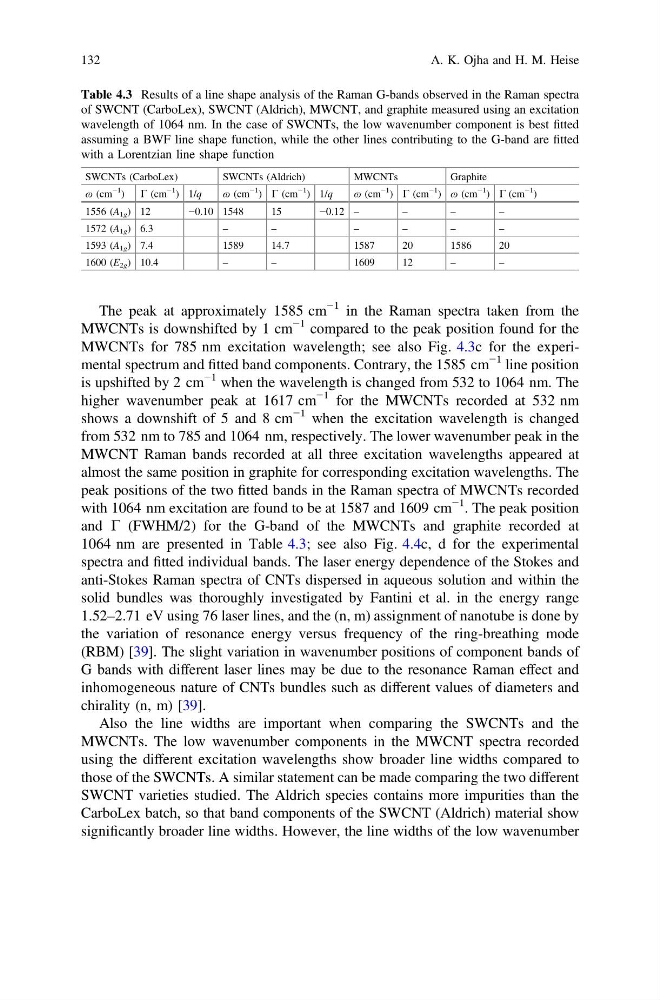
peak positions of the two fitted bands in the Raman spectra of MWCNTs recorded
with 1064 nm excitation are found to be at 1587 and 1609 cm
−1 . The peak position
and C (FWHM/2) for the G-band of the MWCNTs and graphite recorded at
1064 nm are presented in Table 4.3; see also Fig. 4.4c, d for the experimental
spectra and fitted individual bands. The laser energy dependence of the Stokes and
anti-Stokes Raman spectra of CNTs dispersed in aqueous solution and within the
solid bundles was thoroughly investigated by Fantini et al. in the energy range
1.52–2.71 eV using 76 laser lines, and the (n, m) assignment of nanotube is done by
the variation of resonance energy versus frequency of the ring-breathing mode
(RBM) [39]. The slight variation in wavenumber positions of component bands of
G bands with different laser lines may be due to the resonance Raman effect and
inhomogeneous nature of CNTs bundles such as different values of diameters and
chirality (n, m) [39].
Also the line widths are important when comparing the SWCNTs and the
MWCNTs. The low wavenumber components in the MWCNT spectra recorded
using the different excitation wavelengths show broader line widths compared to
those of the SWCNTs. A similar statement can be made comparing the two different
SWCNT varieties studied. The Aldrich species contains more impurities than the
CarboLex batch, so that band components of the SWCNT (Aldrich) material show
significantly broader line widths. However, the line widths of the low wavenumber
Table 4.3 Results of a line shape analysis of the Raman G-bands observed in the Raman spectra
of SWCNT (CarboLex), SWCNT (Aldrich), MWCNT, and graphite measured using an excitation
wavelength of 1064 nm. In the case of SWCNTs, the low wavenumber component is best fitted
assuming a BWF line shape function, while the other lines contributing to the G-band are fitted
with a Lorentzian line shape function
SWCNTs (CarboLex)
SWCNTs (Aldrich)
MWCNTs
Graphite
ɷ (cm
−1
) C (cm
−1
) 1/q
ɷ (cm
−1
) C (cm
−1
) 1/q
ɷ (cm
−1
) C (cm
−1
) ɷ (cm
−1
) C (cm
−1
)
1556 (A 1g ) 12
−0.10 1548
15
−0.12 –
–
–
–
1572 (A 1g ) 6.3
–
–
–
–
–
–
1593 (A 1g ) 7.4
1589
14.7
1587
20
1586
20
1600 (E 2g ) 10.4
–
–
1609
12
–
–
132
A. K. Ojha and H. M. Heise
−1 in the Raman spectra taken from the
MWCNTs is downshifted by 1 cm
−1 compared to the peak position found for the
MWCNTs for 785 nm excitation wavelength; see also Fig. 4.3c for the experimental spectrum and fitted band components. Contrary, the 1585 cm
−1 line position
is upshifted by 2 cm
−1 when the wavelength is changed from 532 to 1064 nm. The
higher wavenumber peak at 1617 cm
−1 for the MWCNTs recorded at 532 nm
shows a downshift of 5 and 8 cm
−1 when the excitation wavelength is changed
from 532 nm to 785 and 1064 nm, respectively. The lower wavenumber peak in the
MWCNT Raman bands recorded at all three excitation wavelengths appeared at
almost the same position in graphite for corresponding excitation wavelengths. The
peak positions of the two fitted bands in the Raman spectra of MWCNTs recorded
with 1064 nm excitation are found to be at 1587 and 1609 cm
−1 . The peak position
and C (FWHM/2) for the G-band of the MWCNTs and graphite recorded at
1064 nm are presented in Table 4.3; see also Fig. 4.4c, d for the experimental
spectra and fitted individual bands. The laser energy dependence of the Stokes and
anti-Stokes Raman spectra of CNTs dispersed in aqueous solution and within the
solid bundles was thoroughly investigated by Fantini et al. in the energy range
1.52–2.71 eV using 76 laser lines, and the (n, m) assignment of nanotube is done by
the variation of resonance energy versus frequency of the ring-breathing mode
(RBM) [39]. The slight variation in wavenumber positions of component bands of
G bands with different laser lines may be due to the resonance Raman effect and
inhomogeneous nature of CNTs bundles such as different values of diameters and
chirality (n, m) [39].
Also the line widths are important when comparing the SWCNTs and the
MWCNTs. The low wavenumber components in the MWCNT spectra recorded
using the different excitation wavelengths show broader line widths compared to
those of the SWCNTs. A similar statement can be made comparing the two different
SWCNT varieties studied. The Aldrich species contains more impurities than the
CarboLex batch, so that band components of the SWCNT (Aldrich) material show
significantly broader line widths. However, the line widths of the low wavenumber
Table 4.3 Results of a line shape analysis of the Raman G-bands observed in the Raman spectra
of SWCNT (CarboLex), SWCNT (Aldrich), MWCNT, and graphite measured using an excitation
wavelength of 1064 nm. In the case of SWCNTs, the low wavenumber component is best fitted
assuming a BWF line shape function, while the other lines contributing to the G-band are fitted
with a Lorentzian line shape function
SWCNTs (CarboLex)
SWCNTs (Aldrich)
MWCNTs
Graphite
ɷ (cm
−1
) C (cm
−1
) 1/q
ɷ (cm
−1
) C (cm
−1
) 1/q
ɷ (cm
−1
) C (cm
−1
) ɷ (cm
−1
) C (cm
−1
)
1556 (A 1g ) 12
−0.10 1548
15
−0.12 –
–
–
–
1572 (A 1g ) 6.3
–
–
–
–
–
–
1593 (A 1g ) 7.4
1589
14.7
1587
20
1586
20
1600 (E 2g ) 10.4
–
–
1609
12
–
–
132
A. K. Ojha and H. M. Heise