

approximately 1545 and 1561 cm
−1 . The mode at 1545 cm
−1 was found to have a
BWF line shape and was assigned to the metallic nature of the SWCNTs. However,
the 1561 cm
−1 mode was best described by a Lorentzian line shape and was
attributed to semiconducting SWCNTs. The peak at approximately 1578 cm
−1 ,
which was also assigned to the metallic nature of the SWCNTs, showed a
Lorentzian line shape. The line shapes of the G-band components depend mostly on
the coupling of the discrete phonons to the electron continuum. While the line at
approximately 1578 cm
−1 reported in [42] is best presented by a Lorentzian line
shape due to the weak coupling of phonons and electron continuum, in the present
study, this peak has a line shape coming closest to a BWF function, which points to
a stronger coupling. The second peak at 1593 cm
−1 or closer to this value, observed
for all three excitation wavelengths, is associated with semiconducting SWCNTs.
This line is believed to appear because of the laser resonance with the energy gap
between 1D singularity in the 3d valence and 3d conduction bands of SWCNTs
with certain diameter [44].
The G-band seen in the Raman spectra of the SWCNTs, (CarboLex) recorded at
the excitation wavelength of 1064 nm, is best fitted assuming four components, one
having a BWF line shape and the other three having Lorentzian line shape functions. However, for the SWCNT (Aldrich) species the G-band could only be
resolved into two components. The value of the fitting parameter, 1/q for both
SWCNTs (CarboLex) and SWCNTs (Aldrich) turns out to be −0.12/−0.11 for the
spectra obtained with 532 nm excitation wavelength. For 785 and 1064 nm, the 1/
q value is found to be −0.30/−0.27 and −0.10/−0.12 for SWCNTs (CarboLex) and
SWCNTs (Aldrich), respectively. The peak positions of the middle components of
the G-bands of both MWCNTs (*1585 cm
−1 ) and SWCNTs (*1590 cm
−1 ) are
changing only slightly with excitation wavelengths. For SWCNTs (CarboLex), the
peak at 1590 cm
−1 for 532 nm is upshifted by 3 cm
−1 for 785 and 1064 nm.
However, the low wavenumber components observed for the SWCNTs show a
downshift of 11 and 10 cm
−1 , respectively, when the excitation wavelength is
changed from 532 nm to 785 and 1064 nm. Similarly, the high wavenumber
components observed for the SWCNTs show a downshift of 3 cm
−1 each when the
excitation wavelength is changed from 532 nm to 785 and 1064 nm.
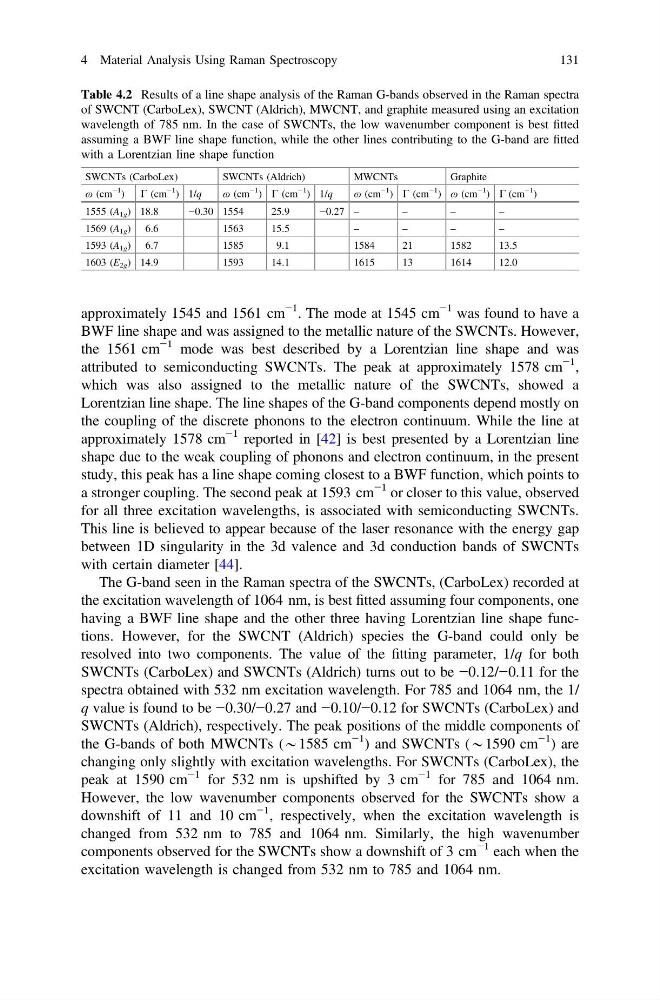
Table 4.2 Results of a line shape analysis of the Raman G-bands observed in the Raman spectra
of SWCNT (CarboLex), SWCNT (Aldrich), MWCNT, and graphite measured using an excitation
wavelength of 785 nm. In the case of SWCNTs, the low wavenumber component is best fitted
assuming a BWF line shape function, while the other lines contributing to the G-band are fitted
with a Lorentzian line shape function
SWCNTs (CarboLex)
SWCNTs (Aldrich)
MWCNTs
Graphite
ɷ (cm
−1
) C (cm
−1
) 1/q
ɷ (cm
−1
) C (cm
−1
) 1/q
ɷ (cm
−1
) C (cm
−1
) ɷ (cm
−1
) C (cm
−1
)
1555 (A 1g ) 18.8
−0.30 1554
25.9
−0.27 –
–
–
–
1569 (A 1g ) 6.6
1563
15.5
–
–
–
–
1593 (A 1g ) 6.7
1585
9.1
1584
21
1582
13.5
1603 (E 2g ) 14.9
1593
14.1
1615
13
1614
12.0
4 Material Analysis Using Raman Spectroscopy
131
−1 . The mode at 1545 cm
−1 was found to have a
BWF line shape and was assigned to the metallic nature of the SWCNTs. However,
the 1561 cm
−1 mode was best described by a Lorentzian line shape and was
attributed to semiconducting SWCNTs. The peak at approximately 1578 cm
−1 ,
which was also assigned to the metallic nature of the SWCNTs, showed a
Lorentzian line shape. The line shapes of the G-band components depend mostly on
the coupling of the discrete phonons to the electron continuum. While the line at
approximately 1578 cm
−1 reported in [42] is best presented by a Lorentzian line
shape due to the weak coupling of phonons and electron continuum, in the present
study, this peak has a line shape coming closest to a BWF function, which points to
a stronger coupling. The second peak at 1593 cm
−1 or closer to this value, observed
for all three excitation wavelengths, is associated with semiconducting SWCNTs.
This line is believed to appear because of the laser resonance with the energy gap
between 1D singularity in the 3d valence and 3d conduction bands of SWCNTs
with certain diameter [44].
The G-band seen in the Raman spectra of the SWCNTs, (CarboLex) recorded at
the excitation wavelength of 1064 nm, is best fitted assuming four components, one
having a BWF line shape and the other three having Lorentzian line shape functions. However, for the SWCNT (Aldrich) species the G-band could only be
resolved into two components. The value of the fitting parameter, 1/q for both
SWCNTs (CarboLex) and SWCNTs (Aldrich) turns out to be −0.12/−0.11 for the
spectra obtained with 532 nm excitation wavelength. For 785 and 1064 nm, the 1/
q value is found to be −0.30/−0.27 and −0.10/−0.12 for SWCNTs (CarboLex) and
SWCNTs (Aldrich), respectively. The peak positions of the middle components of
the G-bands of both MWCNTs (*1585 cm
−1 ) and SWCNTs (*1590 cm
−1 ) are
changing only slightly with excitation wavelengths. For SWCNTs (CarboLex), the
peak at 1590 cm
−1 for 532 nm is upshifted by 3 cm
−1 for 785 and 1064 nm.
However, the low wavenumber components observed for the SWCNTs show a
downshift of 11 and 10 cm
−1 , respectively, when the excitation wavelength is
changed from 532 nm to 785 and 1064 nm. Similarly, the high wavenumber
components observed for the SWCNTs show a downshift of 3 cm
−1 each when the
excitation wavelength is changed from 532 nm to 785 and 1064 nm.
Table 4.2 Results of a line shape analysis of the Raman G-bands observed in the Raman spectra
of SWCNT (CarboLex), SWCNT (Aldrich), MWCNT, and graphite measured using an excitation
wavelength of 785 nm. In the case of SWCNTs, the low wavenumber component is best fitted
assuming a BWF line shape function, while the other lines contributing to the G-band are fitted
with a Lorentzian line shape function
SWCNTs (CarboLex)
SWCNTs (Aldrich)
MWCNTs
Graphite
ɷ (cm
−1
) C (cm
−1
) 1/q
ɷ (cm
−1
) C (cm
−1
) 1/q
ɷ (cm
−1
) C (cm
−1
) ɷ (cm
−1
) C (cm
−1
)
1555 (A 1g ) 18.8
−0.30 1554
25.9
−0.27 –
–
–
–
1569 (A 1g ) 6.6
1563
15.5
–
–
–
–
1593 (A 1g ) 6.7
1585
9.1
1584
21
1582
13.5
1603 (E 2g ) 14.9
1593
14.1
1615
13
1614
12.0
4 Material Analysis Using Raman Spectroscopy
131