

1581.5 cm
−1 , satellite band at 1614.3 cm
−1 ) and, therefore, was fitted with two
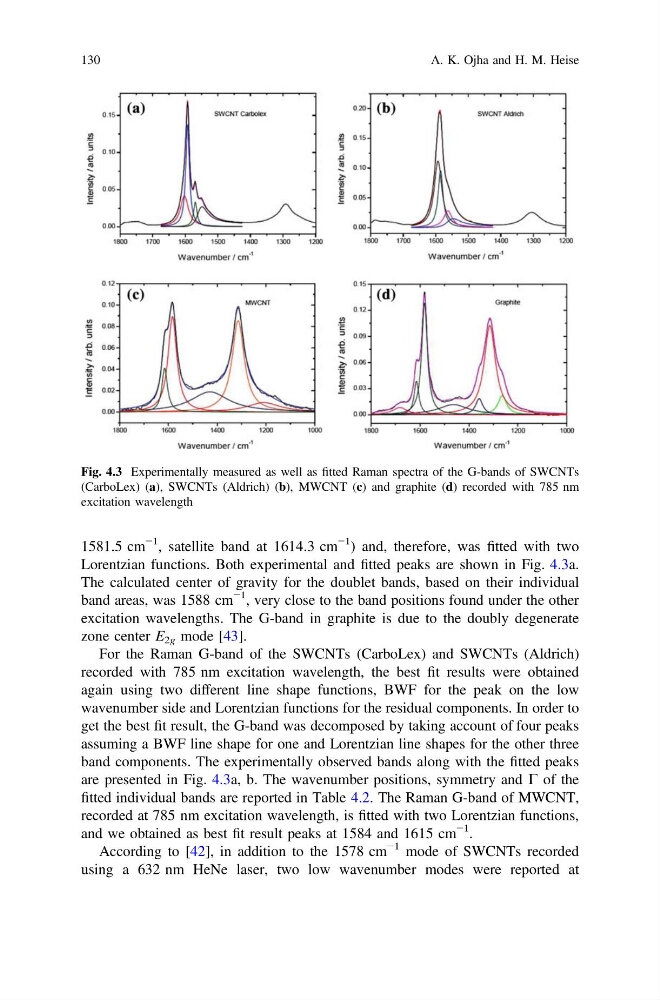
Lorentzian functions. Both experimental and fitted peaks are shown in Fig. 4.3a.
The calculated center of gravity for the doublet bands, based on their individual
band areas, was 1588 cm
−1 , very close to the band positions found under the other
excitation wavelengths. The G-band in graphite is due to the doubly degenerate
zone center E 2g mode [43].
For the Raman G-band of the SWCNTs (CarboLex) and SWCNTs (Aldrich)
recorded with 785 nm excitation wavelength, the best fit results were obtained
again using two different line shape functions, BWF for the peak on the low
wavenumber side and Lorentzian functions for the residual components. In order to
get the best fit result, the G-band was decomposed by taking account of four peaks
assuming a BWF line shape for one and Lorentzian line shapes for the other three
band components. The experimentally observed bands along with the fitted peaks
are presented in Fig. 4.3a, b. The wavenumber positions, symmetry and C of the
fitted individual bands are reported in Table 4.2. The Raman G-band of MWCNT,
recorded at 785 nm excitation wavelength, is fitted with two Lorentzian functions,
and we obtained as best fit result peaks at 1584 and 1615 cm
−1 .
According to [42], in addition to the 1578 cm
−1 mode of SWCNTs recorded
using a 632 nm HeNe laser, two low wavenumber modes were reported at
Fig. 4.3 Experimentally measured as well as fitted Raman spectra of the G-bands of SWCNTs
(CarboLex) (a), SWCNTs (Aldrich) (b), MWCNT (c) and graphite (d) recorded with 785 nm
excitation wavelength
130
A. K. Ojha and H. M. Heise
−1 , satellite band at 1614.3 cm
−1 ) and, therefore, was fitted with two
Lorentzian functions. Both experimental and fitted peaks are shown in Fig. 4.3a.
The calculated center of gravity for the doublet bands, based on their individual
band areas, was 1588 cm
−1 , very close to the band positions found under the other
excitation wavelengths. The G-band in graphite is due to the doubly degenerate
zone center E 2g mode [43].
For the Raman G-band of the SWCNTs (CarboLex) and SWCNTs (Aldrich)
recorded with 785 nm excitation wavelength, the best fit results were obtained
again using two different line shape functions, BWF for the peak on the low
wavenumber side and Lorentzian functions for the residual components. In order to
get the best fit result, the G-band was decomposed by taking account of four peaks
assuming a BWF line shape for one and Lorentzian line shapes for the other three
band components. The experimentally observed bands along with the fitted peaks
are presented in Fig. 4.3a, b. The wavenumber positions, symmetry and C of the
fitted individual bands are reported in Table 4.2. The Raman G-band of MWCNT,
recorded at 785 nm excitation wavelength, is fitted with two Lorentzian functions,
and we obtained as best fit result peaks at 1584 and 1615 cm
−1 .
According to [42], in addition to the 1578 cm
−1 mode of SWCNTs recorded
using a 632 nm HeNe laser, two low wavenumber modes were reported at
Fig. 4.3 Experimentally measured as well as fitted Raman spectra of the G-bands of SWCNTs
(CarboLex) (a), SWCNTs (Aldrich) (b), MWCNT (c) and graphite (d) recorded with 785 nm
excitation wavelength
130
A. K. Ojha and H. M. Heise