

the other bands at 1606/1607 cm
−1 to the E(E 2g ) symmetry species of the semiconducting CNTs [30].
The G-band of graphite is centered at 1587 cm
−1 for the 532 and 1064 nm
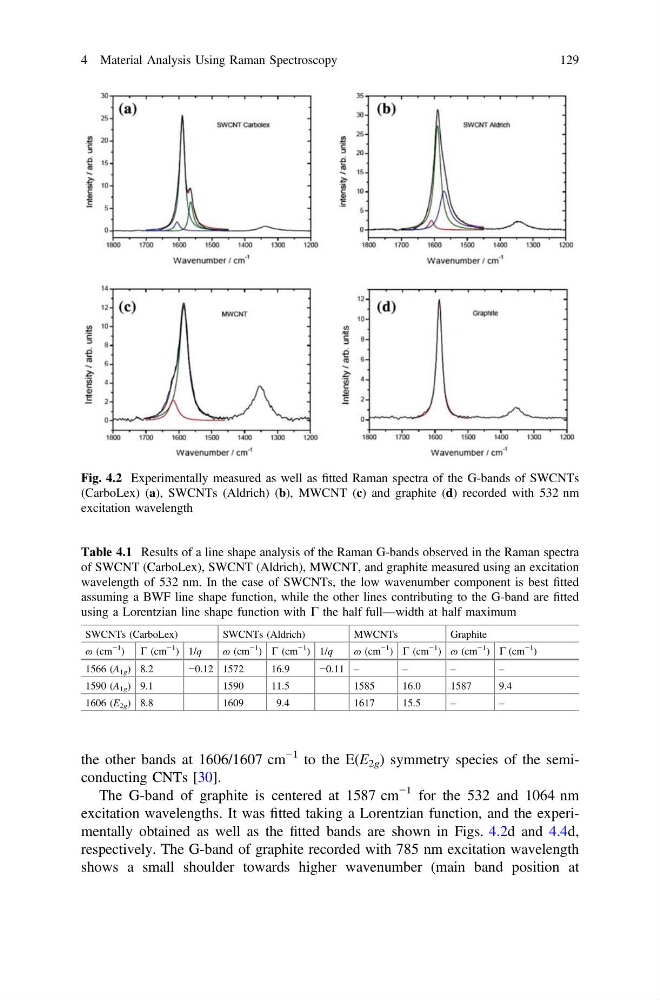
excitation wavelengths. It was fitted taking a Lorentzian function, and the experimentally obtained as well as the fitted bands are shown in Figs. 4.2d and 4.4d,
respectively. The G-band of graphite recorded with 785 nm excitation wavelength
shows a small shoulder towards higher wavenumber (main band position at
Fig. 4.2 Experimentally measured as well as fitted Raman spectra of the G-bands of SWCNTs
(CarboLex) (a), SWCNTs (Aldrich) (b), MWCNT (c) and graphite (d) recorded with 532 nm
excitation wavelength
Table 4.1 Results of a line shape analysis of the Raman G-bands observed in the Raman spectra
of SWCNT (CarboLex), SWCNT (Aldrich), MWCNT, and graphite measured using an excitation
wavelength of 532 nm. In the case of SWCNTs, the low wavenumber component is best fitted
assuming a BWF line shape function, while the other lines contributing to the G-band are fitted
using a Lorentzian line shape function with C the half full—width at half maximum
SWCNTs (CarboLex)
SWCNTs (Aldrich)
MWCNTs
Graphite
ɷ (cm
−1
) C (cm
−1
) 1/q
ɷ (cm
−1
) C (cm
−1
) 1/q
ɷ (cm
−1
) C (cm
−1
) ɷ (cm
−1
) C (cm
−1
)
1566 (A 1g ) 8.2
−0.12 1572
16.9
−0.11 –
–
–
–
1590 (A 1g ) 9.1
1590
11.5
1585
16.0
1587
9.4
1606 (E 2g ) 8.8
1609
9.4
1617
15.5
–
–
4 Material Analysis Using Raman Spectroscopy
129
−1 to the E(E 2g ) symmetry species of the semiconducting CNTs [30].
The G-band of graphite is centered at 1587 cm
−1 for the 532 and 1064 nm
excitation wavelengths. It was fitted taking a Lorentzian function, and the experimentally obtained as well as the fitted bands are shown in Figs. 4.2d and 4.4d,
respectively. The G-band of graphite recorded with 785 nm excitation wavelength
shows a small shoulder towards higher wavenumber (main band position at
Fig. 4.2 Experimentally measured as well as fitted Raman spectra of the G-bands of SWCNTs
(CarboLex) (a), SWCNTs (Aldrich) (b), MWCNT (c) and graphite (d) recorded with 532 nm
excitation wavelength
Table 4.1 Results of a line shape analysis of the Raman G-bands observed in the Raman spectra
of SWCNT (CarboLex), SWCNT (Aldrich), MWCNT, and graphite measured using an excitation
wavelength of 532 nm. In the case of SWCNTs, the low wavenumber component is best fitted
assuming a BWF line shape function, while the other lines contributing to the G-band are fitted
using a Lorentzian line shape function with C the half full—width at half maximum
SWCNTs (CarboLex)
SWCNTs (Aldrich)
MWCNTs
Graphite
ɷ (cm
−1
) C (cm
−1
) 1/q
ɷ (cm
−1
) C (cm
−1
) 1/q
ɷ (cm
−1
) C (cm
−1
) ɷ (cm
−1
) C (cm
−1
)
1566 (A 1g ) 8.2
−0.12 1572
16.9
−0.11 –
–
–
–
1590 (A 1g ) 9.1
1590
11.5
1585
16.0
1587
9.4
1606 (E 2g ) 8.8
1609
9.4
1617
15.5
–
–
4 Material Analysis Using Raman Spectroscopy
129