

6.2 Urban
93
Table 6.2 One to many Water Path Types
Symbol
Description
NRcit
City NR, which is the water consumed by the population of the city, such as,
drinking and preparing food
NRind
Industrial NR, such as, virtual water and evaporation
RPirr
Water taken from the WUS for irrigation purposes (gardens and green zones)
RPwsl
Water supply system leaks, such as, leakage from the pipes that distribute clean
water
RPwwl
Wastewater system leaks, such as, leakage from the pipes that collect wastewater
river (with a certain VU) and the rest from an aquifer (OS). Return to the river (RF)
gives the downstream water (VD). However, NR and RP are different in that they
have more than one WPI (i.e., they have a one to many relationship) as given in
Table 6.2.
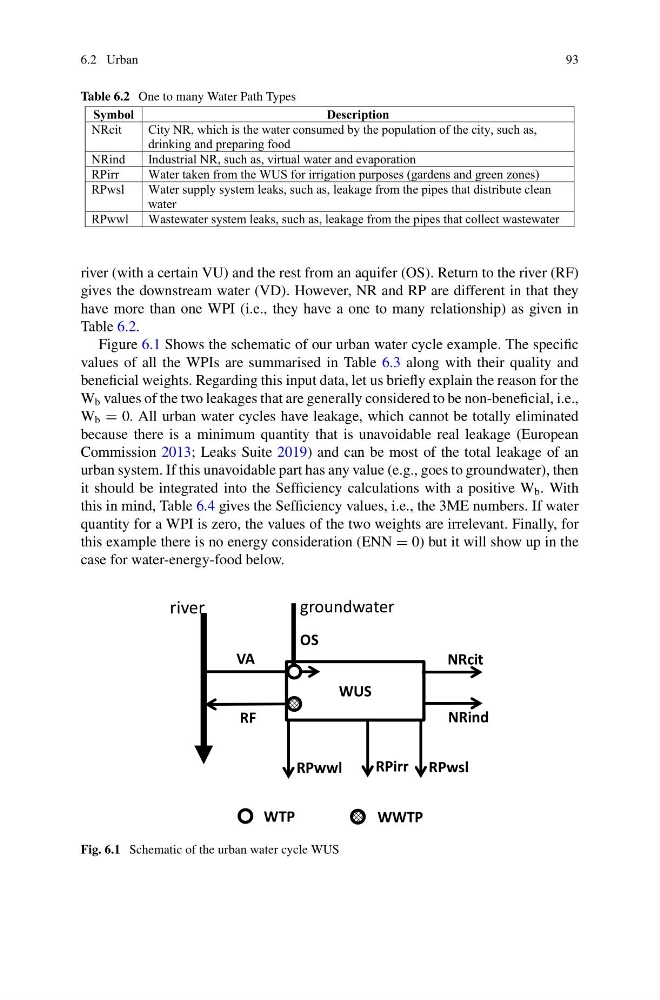
Figure 6.1 Shows the schematic of our urban water cycle example. The specific
values of all the WPIs are summarised in Table 6.3 along with their quality and
beneficial weights. Regarding this input data, let us briefly explain the reason for the
W b values of the two leakages that are generally considered to be non-beneficial, i.e.,
W b = 0. All urban water cycles have leakage, which cannot be totally eliminated
because there is a minimum quantity that is unavoidable real leakage (European
Commission 2013; Leaks Suite 2019) and can be most of the total leakage of an
urban system. If this unavoidable part has any value (e.g., goes to groundwater), then
it should be integrated into the Sefficiency calculations with a positive W b . With
this in mind, Table 6.4 gives the Sefficiency values, i.e., the 3ME numbers. If water
quantity for a WPI is zero, the values of the two weights are irrelevant. Finally, for
this example there is no energy consideration (ENN = 0) but it will show up in the
case for water-energy-food below.
RF
VA
RPwsl
NRcit
WUS
river
RPwwl
NRind
WTP
WWTP
OS
RPirr
groundwater
Fig. 6.1 Schematic of the urban water cycle WUS
93
Table 6.2 One to many Water Path Types
Symbol
Description
NRcit
City NR, which is the water consumed by the population of the city, such as,
drinking and preparing food
NRind
Industrial NR, such as, virtual water and evaporation
RPirr
Water taken from the WUS for irrigation purposes (gardens and green zones)
RPwsl
Water supply system leaks, such as, leakage from the pipes that distribute clean
water
RPwwl
Wastewater system leaks, such as, leakage from the pipes that collect wastewater
river (with a certain VU) and the rest from an aquifer (OS). Return to the river (RF)
gives the downstream water (VD). However, NR and RP are different in that they
have more than one WPI (i.e., they have a one to many relationship) as given in
Table 6.2.
Figure 6.1 Shows the schematic of our urban water cycle example. The specific
values of all the WPIs are summarised in Table 6.3 along with their quality and
beneficial weights. Regarding this input data, let us briefly explain the reason for the
W b values of the two leakages that are generally considered to be non-beneficial, i.e.,
W b = 0. All urban water cycles have leakage, which cannot be totally eliminated
because there is a minimum quantity that is unavoidable real leakage (European
Commission 2013; Leaks Suite 2019) and can be most of the total leakage of an
urban system. If this unavoidable part has any value (e.g., goes to groundwater), then
it should be integrated into the Sefficiency calculations with a positive W b . With
this in mind, Table 6.4 gives the Sefficiency values, i.e., the 3ME numbers. If water
quantity for a WPI is zero, the values of the two weights are irrelevant. Finally, for
this example there is no energy consideration (ENN = 0) but it will show up in the
case for water-energy-food below.
RF
VA
RPwsl
NRcit
WUS
river
RPwwl
NRind
WTP
WWTP
OS
RPirr
groundwater
Fig. 6.1 Schematic of the urban water cycle WUS