

92
6 Applications
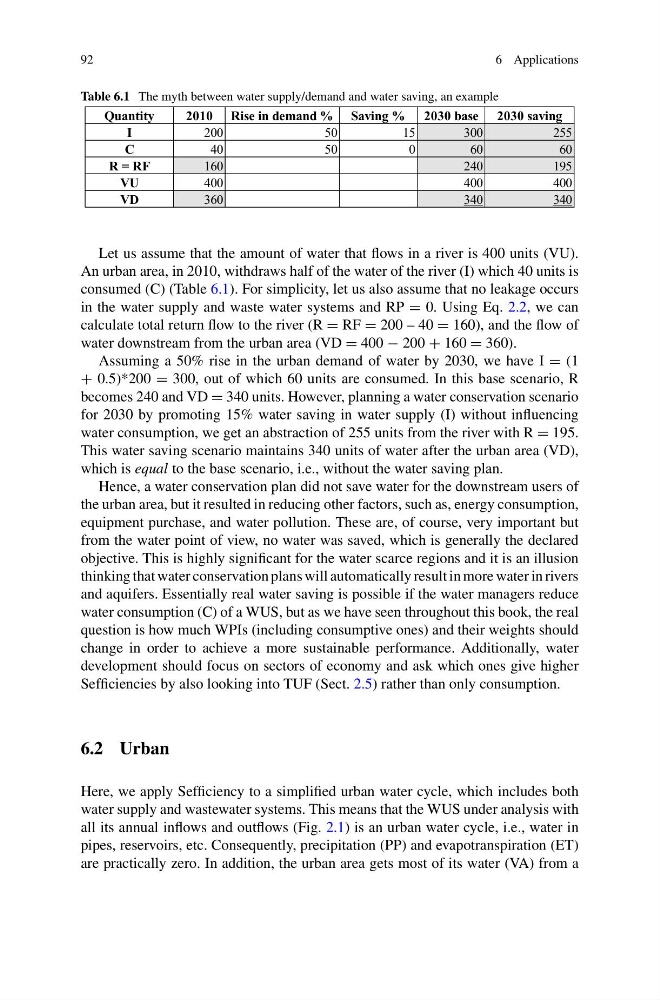
Table 6.1 The myth between water supply/demand and water saving, an example
Quantity
2010 Rise in demand % Saving % 2030 base 2030 saving
I
200
50
15
300
255
C
40
50
0
60
60
R = RF
160
240
195
VU
400
400
400
VD
360
340
340
Let us assume that the amount of water that flows in a river is 400 units (VU).
An urban area, in 2010, withdraws half of the water of the river (I) which 40 units is
consumed (C) (Table 6.1). For simplicity, let us also assume that no leakage occurs
in the water supply and waste water systems and RP = 0. Using Eq. 2.2, we can
calculate total return flow to the river (R = RF = 200 – 40 = 160), and the flow of
water downstream from the urban area (VD = 400 − 200 + 160 = 360).
Assuming a 50% rise in the urban demand of water by 2030, we have I = (1
+ 0.5)*200 = 300, out of which 60 units are consumed. In this base scenario, R
becomes 240 and VD = 340 units. However, planning a water conservation scenario
for 2030 by promoting 15% water saving in water supply (I) without influencing
water consumption, we get an abstraction of 255 units from the river with R = 195.
This water saving scenario maintains 340 units of water after the urban area (VD),
which is equal to the base scenario, i.e., without the water saving plan.
Hence, a water conservation plan did not save water for the downstream users of
the urban area, but it resulted in reducing other factors, such as, energy consumption,
equipment purchase, and water pollution. These are, of course, very important but
from the water point of view, no water was saved, which is generally the declared
objective. This is highly significant for the water scarce regions and it is an illusion
thinking that water conservation plans will automatically result in more water in rivers
and aquifers. Essentially real water saving is possible if the water managers reduce
water consumption (C) of a WUS, but as we have seen throughout this book, the real
question is how much WPIs (including consumptive ones) and their weights should
change in order to achieve a more sustainable performance. Additionally, water
development should focus on sectors of economy and ask which ones give higher
Sefficiencies by also looking into TUF (Sect. 2.5) rather than only consumption.
6.2 Urban
Here, we apply Sefficiency to a simplified urban water cycle, which includes both
water supply and wastewater systems. This means that the WUS under analysis with
all its annual inflows and outflows (Fig. 2.1) is an urban water cycle, i.e., water in
pipes, reservoirs, etc. Consequently, precipitation (PP) and evapotranspiration (ET)
are practically zero. In addition, the urban area gets most of its water (VA) from a
6 Applications
Table 6.1 The myth between water supply/demand and water saving, an example
Quantity
2010 Rise in demand % Saving % 2030 base 2030 saving
I
200
50
15
300
255
C
40
50
0
60
60
R = RF
160
240
195
VU
400
400
400
VD
360
340
340
Let us assume that the amount of water that flows in a river is 400 units (VU).
An urban area, in 2010, withdraws half of the water of the river (I) which 40 units is
consumed (C) (Table 6.1). For simplicity, let us also assume that no leakage occurs
in the water supply and waste water systems and RP = 0. Using Eq. 2.2, we can
calculate total return flow to the river (R = RF = 200 – 40 = 160), and the flow of
water downstream from the urban area (VD = 400 − 200 + 160 = 360).
Assuming a 50% rise in the urban demand of water by 2030, we have I = (1
+ 0.5)*200 = 300, out of which 60 units are consumed. In this base scenario, R
becomes 240 and VD = 340 units. However, planning a water conservation scenario
for 2030 by promoting 15% water saving in water supply (I) without influencing
water consumption, we get an abstraction of 255 units from the river with R = 195.
This water saving scenario maintains 340 units of water after the urban area (VD),
which is equal to the base scenario, i.e., without the water saving plan.
Hence, a water conservation plan did not save water for the downstream users of
the urban area, but it resulted in reducing other factors, such as, energy consumption,
equipment purchase, and water pollution. These are, of course, very important but
from the water point of view, no water was saved, which is generally the declared
objective. This is highly significant for the water scarce regions and it is an illusion
thinking that water conservation plans will automatically result in more water in rivers
and aquifers. Essentially real water saving is possible if the water managers reduce
water consumption (C) of a WUS, but as we have seen throughout this book, the real
question is how much WPIs (including consumptive ones) and their weights should
change in order to achieve a more sustainable performance. Additionally, water
development should focus on sectors of economy and ask which ones give higher
Sefficiencies by also looking into TUF (Sect. 2.5) rather than only consumption.
6.2 Urban
Here, we apply Sefficiency to a simplified urban water cycle, which includes both
water supply and wastewater systems. This means that the WUS under analysis with
all its annual inflows and outflows (Fig. 2.1) is an urban water cycle, i.e., water in
pipes, reservoirs, etc. Consequently, precipitation (PP) and evapotranspiration (ET)
are practically zero. In addition, the urban area gets most of its water (VA) from a