

brightness temperature and hence artificially reduces the measured soil moisture
[83]. But the RFI effect may not be the sole reason; therefore it is encouraged by
the community to carry out more research on this topic, with an extended spectrum
of catchment types, geographical locations and satellite products, so that more
evidential reasons could be revealed and a look-up table might be built.
5 Error Distribution Modelling of SMOS Soil Moisture
Measurements
Since satellite soil moisture measurements can be affected by several error sources
(e.g. algorithms, sensors and physical processes) [95]. Quantification of such uncertainties is particularly important for applying the soil moisture datasets in realtime flood forecasting systems [96]. More importantly, this is the foundation to the
optimal modelling performance in using such soil moisture datasets. Although there
are many studies on exploring the uncertainty of satellite soil moisture estimates in
hydrological applications, they are mainly represented as summary statistics (such as
root-mean-square error (RMSE), Nash-Sutcliffe efficiency (NSE)) [6, 8, 16, 20, 21,
81–85, 97–99], and there is a lack of attention on the error distribution model (such
as probability density function, spatial and temporal correlation, nonstationarity).
Proper identification of satellite soil moisture uncertainty in hydrological modelling is relevant for flow ensemble studies (e.g. error propagation). For example, if the
observed flow falls outside the forecasted ensembles, then further revisions are
required in the formulation of the hydrological model, its states or inputs. However,
0.6
0.4
0.2
0
0.6
0.4
0.2
0
0
0.1
0.2
0.3
0.4
0.5
0.6
0
0.1
0.2
0.3
0.4
0.5
0.6
2010
2012
2013
DoAW ratio=8.1%
DoAW ratio=11.8%
DoAW ratio=15.4%
DoAW ratio=11.4%
2011
0.6
0.4
0.2
0
0.6
0.4
0.2
0
0
0.1
0.2
0.3
0.4
0.5
0.6
0
0.1
0.2
0.3
0.4
0.5
0.6
SMOS descending (m 3
/m 3
)
SMOS descending (m 3
/m 3
)
SMOS ascending (m 3 /m 3 )
SMOS ascending (m 3 /m 3 )
SMOS ascending (m 3 /m 3 )
SMOS ascending (m 3 /m 3 )
SMOS descending (m 3
/m 3
)
SMOS descending (m 3
/m 3
)
a
b
d
c
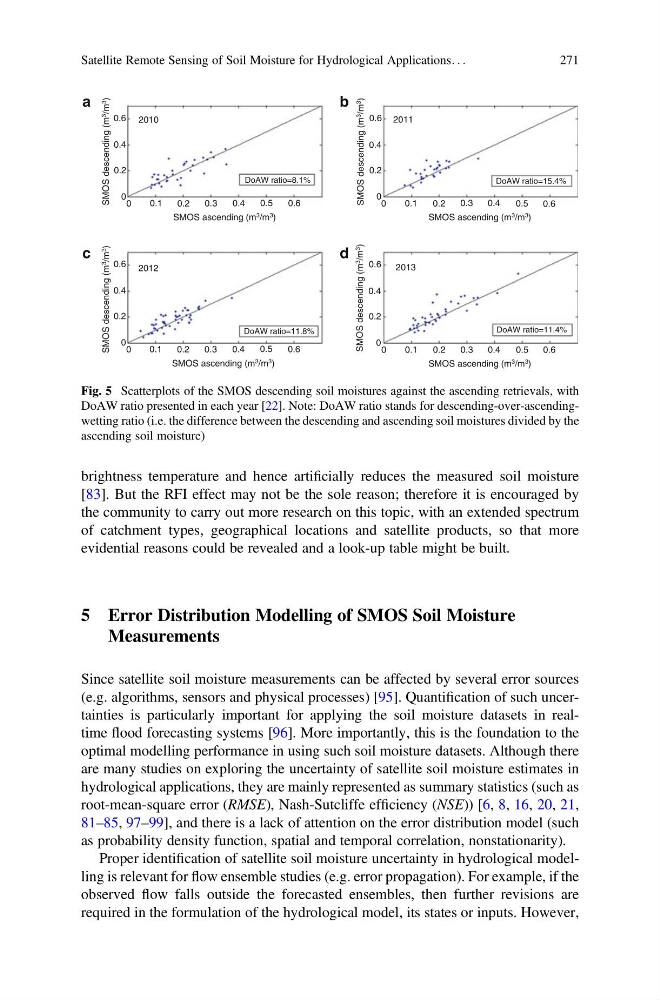
Fig. 5 Scatterplots of the SMOS descending soil moistures against the ascending retrievals, with
DoAW ratio presented in each year [22]. Note: DoAW ratio stands for descending-over-ascendingwetting ratio (i.e. the difference between the descending and ascending soil moistures divided by the
ascending soil moisture)
Satellite Remote Sensing of Soil Moisture for Hydrological Applications. . .
271
[83]. But the RFI effect may not be the sole reason; therefore it is encouraged by
the community to carry out more research on this topic, with an extended spectrum
of catchment types, geographical locations and satellite products, so that more
evidential reasons could be revealed and a look-up table might be built.
5 Error Distribution Modelling of SMOS Soil Moisture
Measurements
Since satellite soil moisture measurements can be affected by several error sources
(e.g. algorithms, sensors and physical processes) [95]. Quantification of such uncertainties is particularly important for applying the soil moisture datasets in realtime flood forecasting systems [96]. More importantly, this is the foundation to the
optimal modelling performance in using such soil moisture datasets. Although there
are many studies on exploring the uncertainty of satellite soil moisture estimates in
hydrological applications, they are mainly represented as summary statistics (such as
root-mean-square error (RMSE), Nash-Sutcliffe efficiency (NSE)) [6, 8, 16, 20, 21,
81–85, 97–99], and there is a lack of attention on the error distribution model (such
as probability density function, spatial and temporal correlation, nonstationarity).
Proper identification of satellite soil moisture uncertainty in hydrological modelling is relevant for flow ensemble studies (e.g. error propagation). For example, if the
observed flow falls outside the forecasted ensembles, then further revisions are
required in the formulation of the hydrological model, its states or inputs. However,
0.6
0.4
0.2
0
0.6
0.4
0.2
0
0
0.1
0.2
0.3
0.4
0.5
0.6
0
0.1
0.2
0.3
0.4
0.5
0.6
2010
2012
2013
DoAW ratio=8.1%
DoAW ratio=11.8%
DoAW ratio=15.4%
DoAW ratio=11.4%
2011
0.6
0.4
0.2
0
0.6
0.4
0.2
0
0
0.1
0.2
0.3
0.4
0.5
0.6
0
0.1
0.2
0.3
0.4
0.5
0.6
SMOS descending (m 3
/m 3
)
SMOS descending (m 3
/m 3
)
SMOS ascending (m 3 /m 3 )
SMOS ascending (m 3 /m 3 )
SMOS ascending (m 3 /m 3 )
SMOS ascending (m 3 /m 3 )
SMOS descending (m 3
/m 3
)
SMOS descending (m 3
/m 3
)
a
b
d
c
Fig. 5 Scatterplots of the SMOS descending soil moistures against the ascending retrievals, with
DoAW ratio presented in each year [22]. Note: DoAW ratio stands for descending-over-ascendingwetting ratio (i.e. the difference between the descending and ascending soil moistures divided by the
ascending soil moisture)
Satellite Remote Sensing of Soil Moisture for Hydrological Applications. . .
271