

The results reported in Table 2 show a large difference in the NSE between
assimilations from physical and social sensors. Table 2 underlines that the best
model performances are not obtained when the assimilation of flow data is
performed using sensors located at the outlet section of the catchment but when
sensors are located along the main river channel, i.e. SC1 [60].
5.1.2 Assimilation of Flow Observations from Both Physical and Social
Sensors
As a matter of fact, the location of the social sensors should typically follow some
rules and be subjected to specific constraints. For example, existence of multiple
sensors in remote areas of the catchment is quite unlikely due to economical and
management reasons. For this reason, in the second part of this section, we assume a
realistic configuration of the social sensors closer to the main urbanised area within
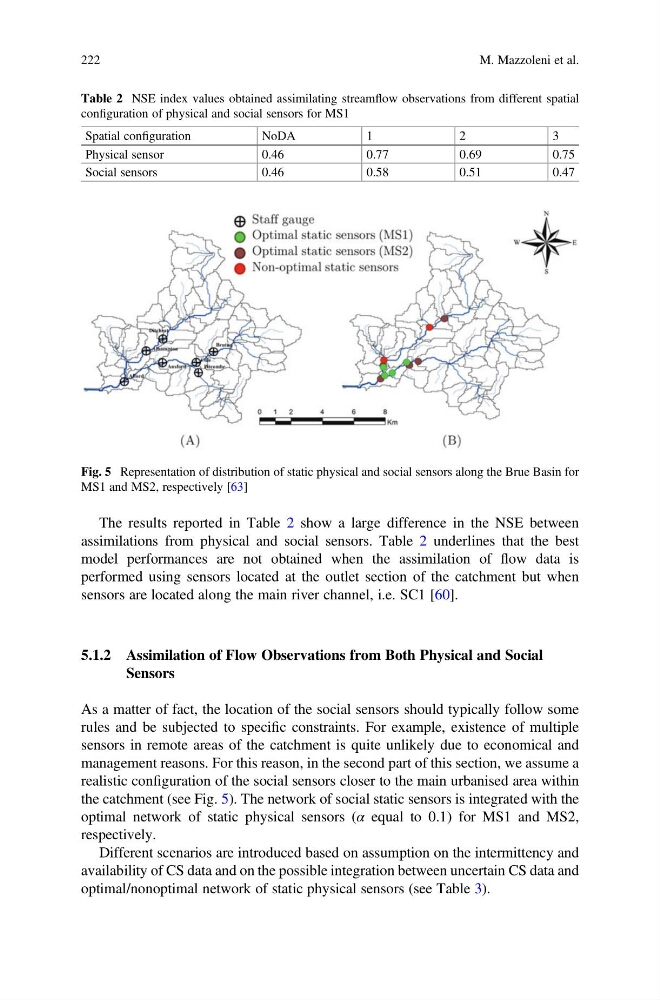
the catchment (see Fig. 5). The network of social static sensors is integrated with the
optimal network of static physical sensors (α equal to 0.1) for MS1 and MS2,
respectively.
Different scenarios are introduced based on assumption on the intermittency and
availability of CS data and on the possible integration between uncertain CS data and
optimal/nonoptimal network of static physical sensors (see Table 3).
Table 2 NSE index values obtained assimilating streamflow observations from different spatial
configuration of physical and social sensors for MS1
Spatial configuration
NoDA
1
2
3
Physical sensor
0.46
0.77
0.69
0.75
Social sensors
0.46
0.58
0.51
0.47
Fig. 5 Representation of distribution of static physical and social sensors along the Brue Basin for
MS1 and MS2, respectively [63]
222
M. Mazzoleni et al.
assimilations from physical and social sensors. Table 2 underlines that the best
model performances are not obtained when the assimilation of flow data is
performed using sensors located at the outlet section of the catchment but when
sensors are located along the main river channel, i.e. SC1 [60].
5.1.2 Assimilation of Flow Observations from Both Physical and Social
Sensors
As a matter of fact, the location of the social sensors should typically follow some
rules and be subjected to specific constraints. For example, existence of multiple
sensors in remote areas of the catchment is quite unlikely due to economical and
management reasons. For this reason, in the second part of this section, we assume a
realistic configuration of the social sensors closer to the main urbanised area within
the catchment (see Fig. 5). The network of social static sensors is integrated with the
optimal network of static physical sensors (α equal to 0.1) for MS1 and MS2,
respectively.
Different scenarios are introduced based on assumption on the intermittency and
availability of CS data and on the possible integration between uncertain CS data and
optimal/nonoptimal network of static physical sensors (see Table 3).
Table 2 NSE index values obtained assimilating streamflow observations from different spatial
configuration of physical and social sensors for MS1
Spatial configuration
NoDA
1
2
3
Physical sensor
0.46
0.77
0.69
0.75
Social sensors
0.46
0.58
0.51
0.47
Fig. 5 Representation of distribution of static physical and social sensors along the Brue Basin for
MS1 and MS2, respectively [63]
222
M. Mazzoleni et al.