

benchmark in order to compare the assimilation performances using social sensors.
A main assumption of this study is that flow observations from social sensors are
accepted to be less accurate, with random observation error both in time and space,
than the ones from physical sensors.
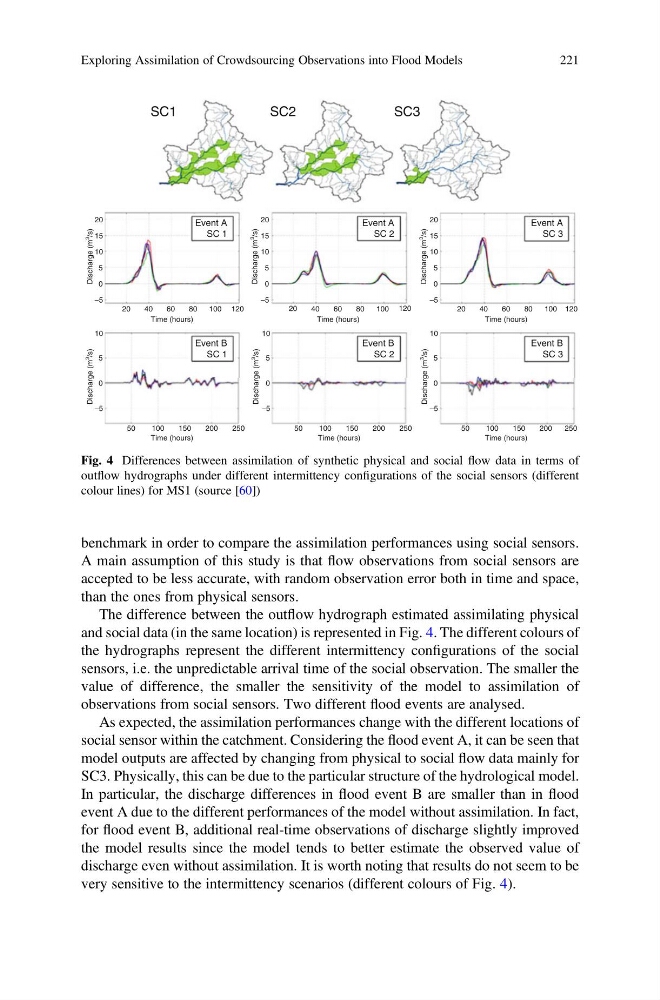
The difference between the outflow hydrograph estimated assimilating physical
and social data (in the same location) is represented in Fig. 4. The different colours of
the hydrographs represent the different intermittency configurations of the social
sensors, i.e. the unpredictable arrival time of the social observation. The smaller the
value of difference, the smaller the sensitivity of the model to assimilation of
observations from social sensors. Two different flood events are analysed.
As expected, the assimilation performances change with the different locations of
social sensor within the catchment. Considering the flood event A, it can be seen that
model outputs are affected by changing from physical to social flow data mainly for
SC3. Physically, this can be due to the particular structure of the hydrological model.
In particular, the discharge differences in flood event B are smaller than in flood
event A due to the different performances of the model without assimilation. In fact,
for flood event B, additional real-time observations of discharge slightly improved
the model results since the model tends to better estimate the observed value of
discharge even without assimilation. It is worth noting that results do not seem to be
very sensitive to the intermittency scenarios (different colours of Fig. 4).
SC1
SC2
SC3
Event A
SC 1
Event B
SC 1
Event A
SC 2
Event B
SC 2
Event A
SC 3
Event B
SC 3
20
15
10
10
5
5
0
0
–5
–5
20
40
60
80
100 120
Time (hours)
Time (hours)
Discharge (m 3
/s)
Discharge (m 3
/s)
20
15
10
5
0
–5
20
40
60
80
100 120
Time (hours)
Discharge (m 3
/s)
20
15
10
5
0
–5
20
40
60
80
100 120
Time (hours)
Discharge (m 3
/s)
50
100
150
200
250
10
5
0
–5
Time (hours)
Discharge (m 3
/s)
50
100
150
200
250
10
5
0
–5
Time (hours)
Discharge (m 3
/s)
50
100
150
200
250
Fig. 4 Differences between assimilation of synthetic physical and social flow data in terms of
outflow hydrographs under different intermittency configurations of the social sensors (different
colour lines) for MS1 (source [60])
Exploring Assimilation of Crowdsourcing Observations into Flood Models
221
A main assumption of this study is that flow observations from social sensors are
accepted to be less accurate, with random observation error both in time and space,
than the ones from physical sensors.
The difference between the outflow hydrograph estimated assimilating physical
and social data (in the same location) is represented in Fig. 4. The different colours of
the hydrographs represent the different intermittency configurations of the social
sensors, i.e. the unpredictable arrival time of the social observation. The smaller the
value of difference, the smaller the sensitivity of the model to assimilation of
observations from social sensors. Two different flood events are analysed.
As expected, the assimilation performances change with the different locations of
social sensor within the catchment. Considering the flood event A, it can be seen that
model outputs are affected by changing from physical to social flow data mainly for
SC3. Physically, this can be due to the particular structure of the hydrological model.
In particular, the discharge differences in flood event B are smaller than in flood
event A due to the different performances of the model without assimilation. In fact,
for flood event B, additional real-time observations of discharge slightly improved
the model results since the model tends to better estimate the observed value of
discharge even without assimilation. It is worth noting that results do not seem to be
very sensitive to the intermittency scenarios (different colours of Fig. 4).
SC1
SC2
SC3
Event A
SC 1
Event B
SC 1
Event A
SC 2
Event B
SC 2
Event A
SC 3
Event B
SC 3
20
15
10
10
5
5
0
0
–5
–5
20
40
60
80
100 120
Time (hours)
Time (hours)
Discharge (m 3
/s)
Discharge (m 3
/s)
20
15
10
5
0
–5
20
40
60
80
100 120
Time (hours)
Discharge (m 3
/s)
20
15
10
5
0
–5
20
40
60
80
100 120
Time (hours)
Discharge (m 3
/s)
50
100
150
200
250
10
5
0
–5
Time (hours)
Discharge (m 3
/s)
50
100
150
200
250
10
5
0
–5
Time (hours)
Discharge (m 3
/s)
50
100
150
200
250
Fig. 4 Differences between assimilation of synthetic physical and social flow data in terms of
outflow hydrographs under different intermittency configurations of the social sensors (different
colour lines) for MS1 (source [60])
Exploring Assimilation of Crowdsourcing Observations into Flood Models
221