

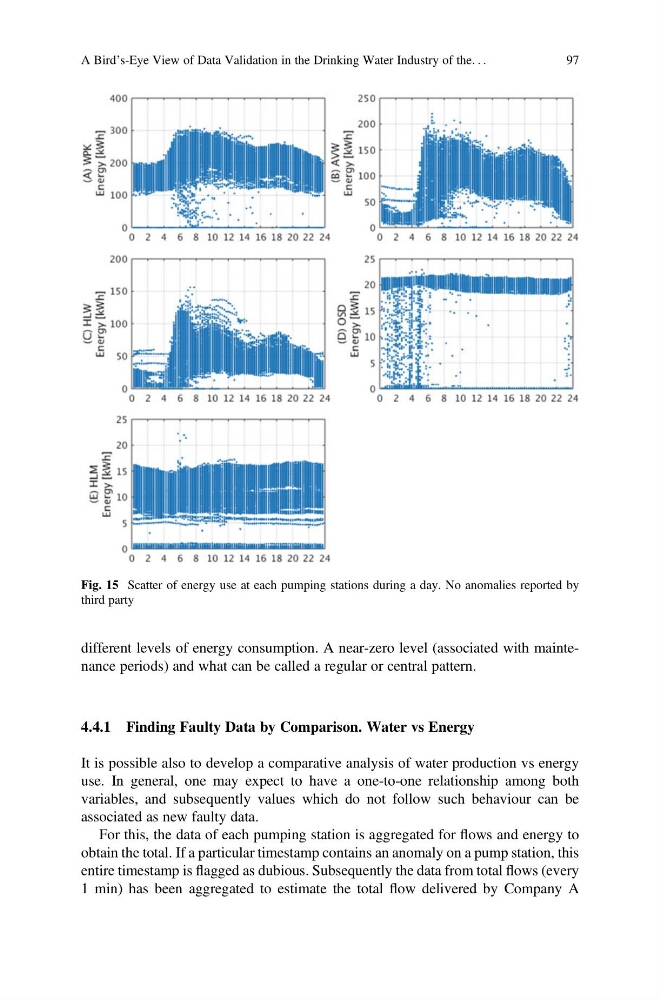
different levels of energy consumption. A near-zero level (associated with maintenance periods) and what can be called a regular or central pattern.
4.4.1 Finding Faulty Data by Comparison. Water vs Energy
It is possible also to develop a comparative analysis of water production vs energy
use. In general, one may expect to have a one-to-one relationship among both
variables, and subsequently values which do not follow such behaviour can be
associated as new faulty data.
For this, the data of each pumping station is aggregated for flows and energy to
obtain the total. If a particular timestamp contains an anomaly on a pump station, this
entire timestamp is flagged as dubious. Subsequently the data from total flows (every
1 min) has been aggregated to estimate the total flow delivered by Company A
Fig. 15 Scatter of energy use at each pumping stations during a day. No anomalies reported by
third party
A Bird’s-Eye View of Data Validation in the Drinking Water Industry of the. . .
97
4.4.1 Finding Faulty Data by Comparison. Water vs Energy
It is possible also to develop a comparative analysis of water production vs energy
use. In general, one may expect to have a one-to-one relationship among both
variables, and subsequently values which do not follow such behaviour can be
associated as new faulty data.
For this, the data of each pumping station is aggregated for flows and energy to
obtain the total. If a particular timestamp contains an anomaly on a pump station, this
entire timestamp is flagged as dubious. Subsequently the data from total flows (every
1 min) has been aggregated to estimate the total flow delivered by Company A
Fig. 15 Scatter of energy use at each pumping stations during a day. No anomalies reported by
third party
A Bird’s-Eye View of Data Validation in the Drinking Water Industry of the. . .
97