

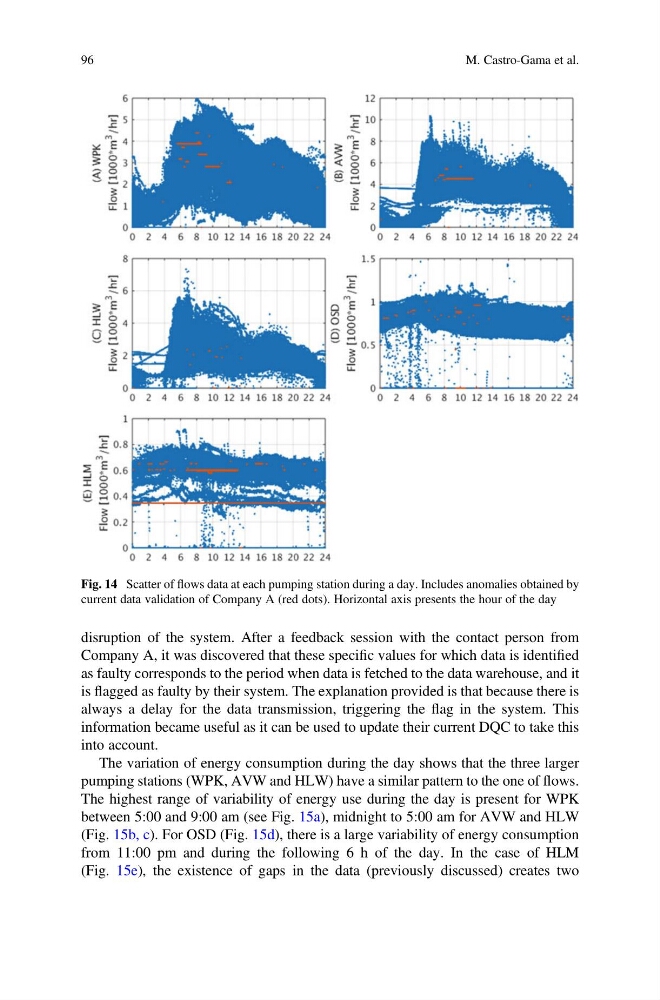
disruption of the system. After a feedback session with the contact person from
Company A, it was discovered that these specific values for which data is identified
as faulty corresponds to the period when data is fetched to the data warehouse, and it
is flagged as faulty by their system. The explanation provided is that because there is
always a delay for the data transmission, triggering the flag in the system. This
information became useful as it can be used to update their current DQC to take this
into account.
The variation of energy consumption during the day shows that the three larger
pumping stations (WPK, AVW and HLW) have a similar pattern to the one of flows.
The highest range of variability of energy use during the day is present for WPK
between 5:00 and 9:00 am (see Fig. 15a), midnight to 5:00 am for AVW and HLW
(Fig. 15b, c). For OSD (Fig. 15d), there is a large variability of energy consumption
from 11:00 pm and during the following 6 h of the day. In the case of HLM
(Fig. 15e), the existence of gaps in the data (previously discussed) creates two
Fig. 14 Scatter of flows data at each pumping station during a day. Includes anomalies obtained by
current data validation of Company A (red dots). Horizontal axis presents the hour of the day
96
M. Castro-Gama et al.
Company A, it was discovered that these specific values for which data is identified
as faulty corresponds to the period when data is fetched to the data warehouse, and it
is flagged as faulty by their system. The explanation provided is that because there is
always a delay for the data transmission, triggering the flag in the system. This
information became useful as it can be used to update their current DQC to take this
into account.
The variation of energy consumption during the day shows that the three larger
pumping stations (WPK, AVW and HLW) have a similar pattern to the one of flows.
The highest range of variability of energy use during the day is present for WPK
between 5:00 and 9:00 am (see Fig. 15a), midnight to 5:00 am for AVW and HLW
(Fig. 15b, c). For OSD (Fig. 15d), there is a large variability of energy consumption
from 11:00 pm and during the following 6 h of the day. In the case of HLM
(Fig. 15e), the existence of gaps in the data (previously discussed) creates two
Fig. 14 Scatter of flows data at each pumping station during a day. Includes anomalies obtained by
current data validation of Company A (red dots). Horizontal axis presents the hour of the day
96
M. Castro-Gama et al.