

constantly picked by the system as faulty data near 4,510 m
3 /h. In the case of
pumping station OSD (see Fig. 14d), the predominant faulty detection value is
0 m
3 /h between 9 am and 11 am. In the case of PS HLM (see Fig. 14e), there is a
value constantly picked by the system as faulty data near 346 m
3 /h (all day) and near
600 m
3
/h (between 6:30 am and 13:30 am). Once again, this is consistent with a
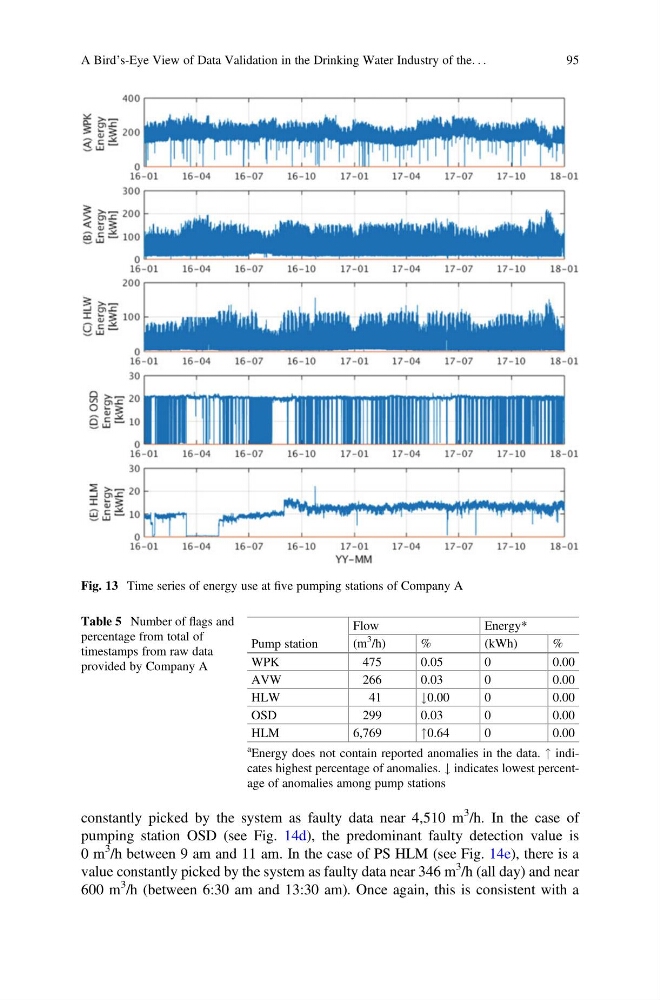
Fig. 13 Time series of energy use at five pumping stations of Company A
Table 5 Number of flags and
percentage from total of
timestamps from raw data
provided by Company A
Pump station
Flow
Energy*
(m
3
/h)
%
(kWh)
%
WPK
475
0.05
0
0.00
AVW
266
0.03
0
0.00
HLW
41
#0.00
0
0.00
OSD
299
0.03
0
0.00
HLM
6,769
"0.64
0
0.00
a Energy does not contain reported anomalies in the data. " indicates highest percentage of anomalies. # indicates lowest percentage of anomalies among pump stations
A Bird’s-Eye View of Data Validation in the Drinking Water Industry of the. . .
95
3 /h. In the case of
pumping station OSD (see Fig. 14d), the predominant faulty detection value is
0 m
3 /h between 9 am and 11 am. In the case of PS HLM (see Fig. 14e), there is a
value constantly picked by the system as faulty data near 346 m
3 /h (all day) and near
600 m
3
/h (between 6:30 am and 13:30 am). Once again, this is consistent with a
Fig. 13 Time series of energy use at five pumping stations of Company A
Table 5 Number of flags and
percentage from total of
timestamps from raw data
provided by Company A
Pump station
Flow
Energy*
(m
3
/h)
%
(kWh)
%
WPK
475
0.05
0
0.00
AVW
266
0.03
0
0.00
HLW
41
#0.00
0
0.00
OSD
299
0.03
0
0.00
HLM
6,769
"0.64
0
0.00
a Energy does not contain reported anomalies in the data. " indicates highest percentage of anomalies. # indicates lowest percentage of anomalies among pump stations
A Bird’s-Eye View of Data Validation in the Drinking Water Industry of the. . .
95