

(every 15 min). The time series of accumulated flows itself will not provide
additional information, as the anomalous timestamps are removed. For that reason,
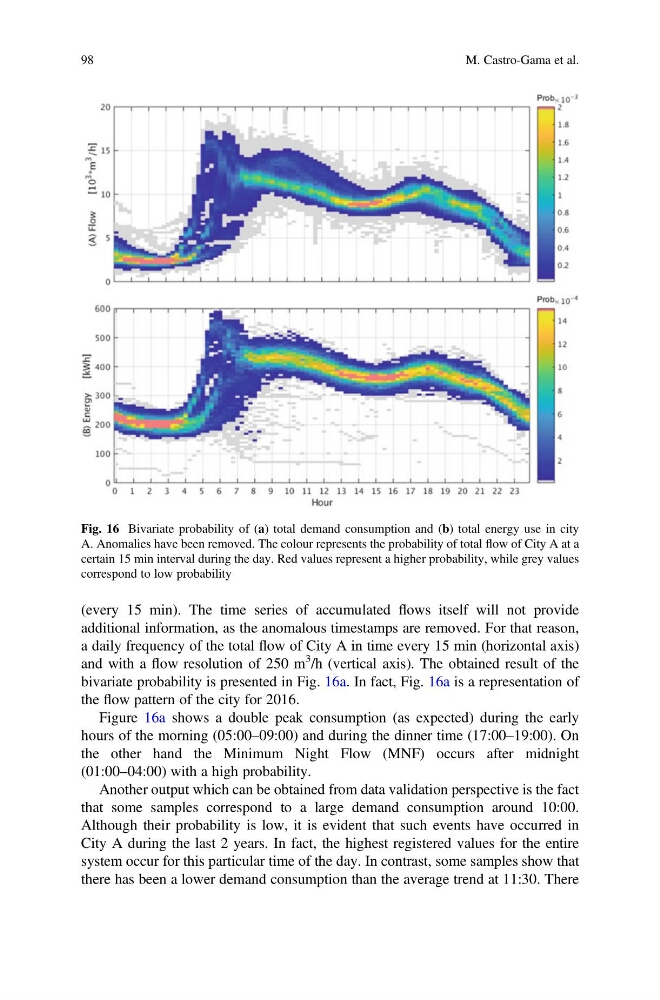
a daily frequency of the total flow of City A in time every 15 min (horizontal axis)
and with a flow resolution of 250 m
3 /h (vertical axis). The obtained result of the
bivariate probability is presented in Fig. 16a. In fact, Fig. 16a is a representation of
the flow pattern of the city for 2016.
Figure 16a shows a double peak consumption (as expected) during the early
hours of the morning (05:00–09:00) and during the dinner time (17:00–19:00). On
the other hand the Minimum Night Flow (MNF) occurs after midnight
(01:00–04:00) with a high probability.
Another output which can be obtained from data validation perspective is the fact
that some samples correspond to a large demand consumption around 10:00.
Although their probability is low, it is evident that such events have occurred in
City A during the last 2 years. In fact, the highest registered values for the entire
system occur for this particular time of the day. In contrast, some samples show that
there has been a lower demand consumption than the average trend at 11:30. There
Fig. 16 Bivariate probability of (a) total demand consumption and (b) total energy use in city
A. Anomalies have been removed. The colour represents the probability of total flow of City A at a
certain 15 min interval during the day. Red values represent a higher probability, while grey values
correspond to low probability
98
M. Castro-Gama et al.
additional information, as the anomalous timestamps are removed. For that reason,
a daily frequency of the total flow of City A in time every 15 min (horizontal axis)
and with a flow resolution of 250 m
3 /h (vertical axis). The obtained result of the
bivariate probability is presented in Fig. 16a. In fact, Fig. 16a is a representation of
the flow pattern of the city for 2016.
Figure 16a shows a double peak consumption (as expected) during the early
hours of the morning (05:00–09:00) and during the dinner time (17:00–19:00). On
the other hand the Minimum Night Flow (MNF) occurs after midnight
(01:00–04:00) with a high probability.
Another output which can be obtained from data validation perspective is the fact
that some samples correspond to a large demand consumption around 10:00.
Although their probability is low, it is evident that such events have occurred in
City A during the last 2 years. In fact, the highest registered values for the entire
system occur for this particular time of the day. In contrast, some samples show that
there has been a lower demand consumption than the average trend at 11:30. There
Fig. 16 Bivariate probability of (a) total demand consumption and (b) total energy use in city
A. Anomalies have been removed. The colour represents the probability of total flow of City A at a
certain 15 min interval during the day. Red values represent a higher probability, while grey values
correspond to low probability
98
M. Castro-Gama et al.