

10. The scanning mass range can be narrowed to m/z 530–610 for
analysis of carotenoids. By extending the scan to m/z
350–1000 you have the possibility to analyze other compounds in the same extracts, such as chlorophylls and tocopherols. Triple quadrupole mass spectrometer can then be used
to obtain fragment spectra of those compounds. Note that
tocopherols must be analyzed by PDA/DAD at 295 nm.
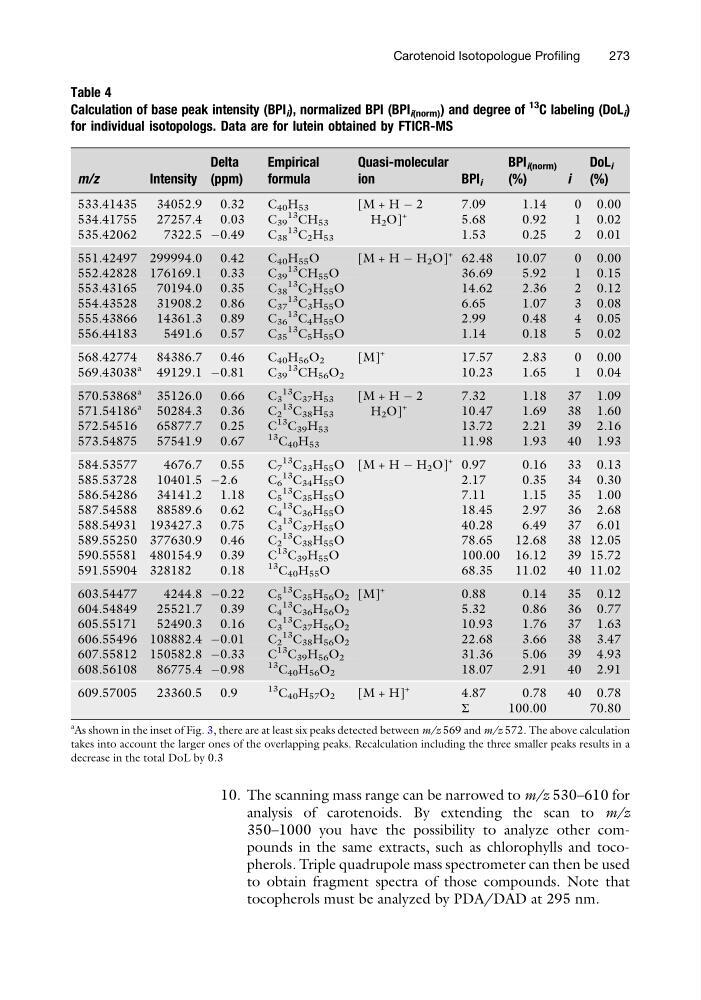
Table 4
Calculation of base peak intensity (BPI i ), normalized BPI (BPI i(norm) ) and degree of
13 C labeling (DoL i )
for individual isotopologs. Data are for lutein obtained by FTICR-MS
m/z
Intensity
Delta
(ppm)
Empirical
formula
Quasi-molecular
ion
BPI i
BPI i(norm)
(%)
i
DoL i
(%)
533.41435
34052.9 0.32
C 40 H 53
[M + H À 2
H 2 O]
+
7.09
1.14
0 0.00
534.41755
27257.4 0.03
C 39
13 CH 53
5.68
0.92
1 0.02
535.42062
7322.5 À0.49
C 38
13 C 2 H 53
1.53
0.25
2 0.01
551.42497 299994.0 0.42
C 40 H 55 O
[ M+HÀ H 2 O]
+ 62.48
10.07
0 0.00
552.42828 176169.1 0.33
C 39
13 CH 55 O
36.69
5.92
1 0.15
553.43165
70194.0 0.35
C 38
13 C 2 H 55 O
14.62
2.36
2 0.12
554.43528
31908.2 0.86
C 37
13 C 3 H 55 O
6.65
1.07
3 0.08
555.43866
14361.3 0.89
C 36
13 C 4 H 55 O
2.99
0.48
4 0.05
556.44183
5491.6 0.57
C 35
13 C 5 H 55 O
1.14
0.18
5 0.02
568.42774
84386.7 0.46
C 40 H 56 O 2
[M]
+
17.57
2.83
0 0.00
569.43038
a
49129.1 À0.81
C 39
13 CH 56 O 2
10.23
1.65
1 0.04
570.53868
a
35126.0 0.66
C 3
13
C 37 H 53
[M + H À 2
H 2 O]
+
7.32
1.18
37 1.09
571.54186
a
50284.3 0.36
C 2
13
C 38 H 53
10.47
1.69
38 1.60
572.54516
65877.7 0.25
C
13
C 39 H 53
13.72
2.21
39 2.16
573.54875
57541.9 0.67
13 C 40 H 53
11.98
1.93
40 1.93
584.53577
4676.7 0.55
C 7
13
C 33 H 55 O [M + H À H 2 O]
+ 0.97
0.16
33 0.13
585.53728
10401.5 À2.6
C 6
13
C 34 H 55 O
2.17
0.35
34 0.30
586.54286
34141.2 1.18
C 5
13
C 35 H 55 O
7.11
1.15
35 1.00
587.54588
88589.6 0.62
C 4
13
C 36 H 55 O
18.45
2.97
36 2.68
588.54931 193427.3 0.75
C 3
13
C 37 H 55 O
40.28
6.49
37 6.01
589.55250 377630.9 0.46
C 2
13
C 38 H 55 O
78.65
12.68
38 12.05
590.55581 480154.9 0.39
C
13
C 39 H 55 O
100.00 16.12
39 15.72
591.55904 328182
0.18
13 C 40 H 55 O
68.35
11.02
40 11.02
603.54477
4244.8 À0.22
C 5
13
C 35 H 56 O 2 [M]
+
0.88
0.14
35 0.12
604.54849
25521.7 0.39
C 4
13
C 36 H 56 O 2
5.32
0.86
36 0.77
605.55171
52490.3 0.16
C 3
13
C 37 H 56 O 2
10.93
1.76
37 1.63
606.55496 108882.4 À0.01
C 2
13
C 38 H 56 O 2
22.68
3.66
38 3.47
607.55812 150582.8 À0.33
C
13
C 39 H 56 O 2
31.36
5.06
39 4.93
608.56108
86775.4 À0.98
13 C 40 H 56 O 2
18.07
2.91
40 2.91
609.57005
23360.5 0.9
13 C 40 H 57 O 2
[M + H]
+
4.87
0.78
40 0.78
Σ
100.00
70.80
a
As shown in the inset of Fig. 3, there are at least six peaks detected between m/z 569 and m/z 572. The above calculation
takes into account the larger ones of the overlapping peaks. Recalculation including the three smaller peaks results in a
decrease in the total DoL by 0.3
Carotenoid Isotopologue Profiling
273
analysis of carotenoids. By extending the scan to m/z
350–1000 you have the possibility to analyze other compounds in the same extracts, such as chlorophylls and tocopherols. Triple quadrupole mass spectrometer can then be used
to obtain fragment spectra of those compounds. Note that
tocopherols must be analyzed by PDA/DAD at 295 nm.
Table 4
Calculation of base peak intensity (BPI i ), normalized BPI (BPI i(norm) ) and degree of
13 C labeling (DoL i )
for individual isotopologs. Data are for lutein obtained by FTICR-MS
m/z
Intensity
Delta
(ppm)
Empirical
formula
Quasi-molecular
ion
BPI i
BPI i(norm)
(%)
i
DoL i
(%)
533.41435
34052.9 0.32
C 40 H 53
[M + H À 2
H 2 O]
+
7.09
1.14
0 0.00
534.41755
27257.4 0.03
C 39
13 CH 53
5.68
0.92
1 0.02
535.42062
7322.5 À0.49
C 38
13 C 2 H 53
1.53
0.25
2 0.01
551.42497 299994.0 0.42
C 40 H 55 O
[ M+HÀ H 2 O]
+ 62.48
10.07
0 0.00
552.42828 176169.1 0.33
C 39
13 CH 55 O
36.69
5.92
1 0.15
553.43165
70194.0 0.35
C 38
13 C 2 H 55 O
14.62
2.36
2 0.12
554.43528
31908.2 0.86
C 37
13 C 3 H 55 O
6.65
1.07
3 0.08
555.43866
14361.3 0.89
C 36
13 C 4 H 55 O
2.99
0.48
4 0.05
556.44183
5491.6 0.57
C 35
13 C 5 H 55 O
1.14
0.18
5 0.02
568.42774
84386.7 0.46
C 40 H 56 O 2
[M]
+
17.57
2.83
0 0.00
569.43038
a
49129.1 À0.81
C 39
13 CH 56 O 2
10.23
1.65
1 0.04
570.53868
a
35126.0 0.66
C 3
13
C 37 H 53
[M + H À 2
H 2 O]
+
7.32
1.18
37 1.09
571.54186
a
50284.3 0.36
C 2
13
C 38 H 53
10.47
1.69
38 1.60
572.54516
65877.7 0.25
C
13
C 39 H 53
13.72
2.21
39 2.16
573.54875
57541.9 0.67
13 C 40 H 53
11.98
1.93
40 1.93
584.53577
4676.7 0.55
C 7
13
C 33 H 55 O [M + H À H 2 O]
+ 0.97
0.16
33 0.13
585.53728
10401.5 À2.6
C 6
13
C 34 H 55 O
2.17
0.35
34 0.30
586.54286
34141.2 1.18
C 5
13
C 35 H 55 O
7.11
1.15
35 1.00
587.54588
88589.6 0.62
C 4
13
C 36 H 55 O
18.45
2.97
36 2.68
588.54931 193427.3 0.75
C 3
13
C 37 H 55 O
40.28
6.49
37 6.01
589.55250 377630.9 0.46
C 2
13
C 38 H 55 O
78.65
12.68
38 12.05
590.55581 480154.9 0.39
C
13
C 39 H 55 O
100.00 16.12
39 15.72
591.55904 328182
0.18
13 C 40 H 55 O
68.35
11.02
40 11.02
603.54477
4244.8 À0.22
C 5
13
C 35 H 56 O 2 [M]
+
0.88
0.14
35 0.12
604.54849
25521.7 0.39
C 4
13
C 36 H 56 O 2
5.32
0.86
36 0.77
605.55171
52490.3 0.16
C 3
13
C 37 H 56 O 2
10.93
1.76
37 1.63
606.55496 108882.4 À0.01
C 2
13
C 38 H 56 O 2
22.68
3.66
38 3.47
607.55812 150582.8 À0.33
C
13
C 39 H 56 O 2
31.36
5.06
39 4.93
608.56108
86775.4 À0.98
13 C 40 H 56 O 2
18.07
2.91
40 2.91
609.57005
23360.5 0.9
13 C 40 H 57 O 2
[M + H]
+
4.87
0.78
40 0.78
Σ
100.00
70.80
a
As shown in the inset of Fig. 3, there are at least six peaks detected between m/z 569 and m/z 572. The above calculation
takes into account the larger ones of the overlapping peaks. Recalculation including the three smaller peaks results in a
decrease in the total DoL by 0.3
Carotenoid Isotopologue Profiling
273